. 2009 Jan 1;182(1):347-60.
doi: 10.4049/jimmunol.182.1.347.

Genomic instability resulting from Blm deficiency compromises development, maintenance, and function of the B cell lineage

Affiliations

Genomic instability resulting from Blm deficiency compromises development, maintenance, and function of the B cell lineage

Holger Babbe et al. J Immunol. .

Abstract

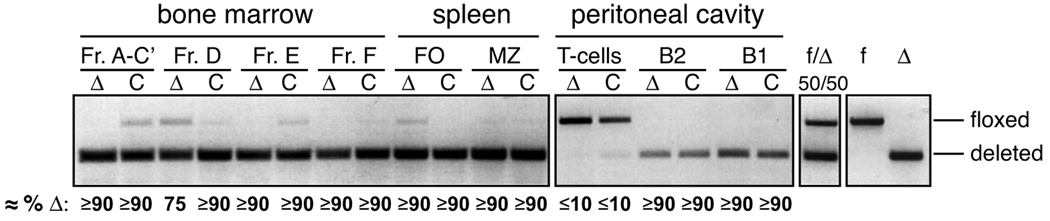
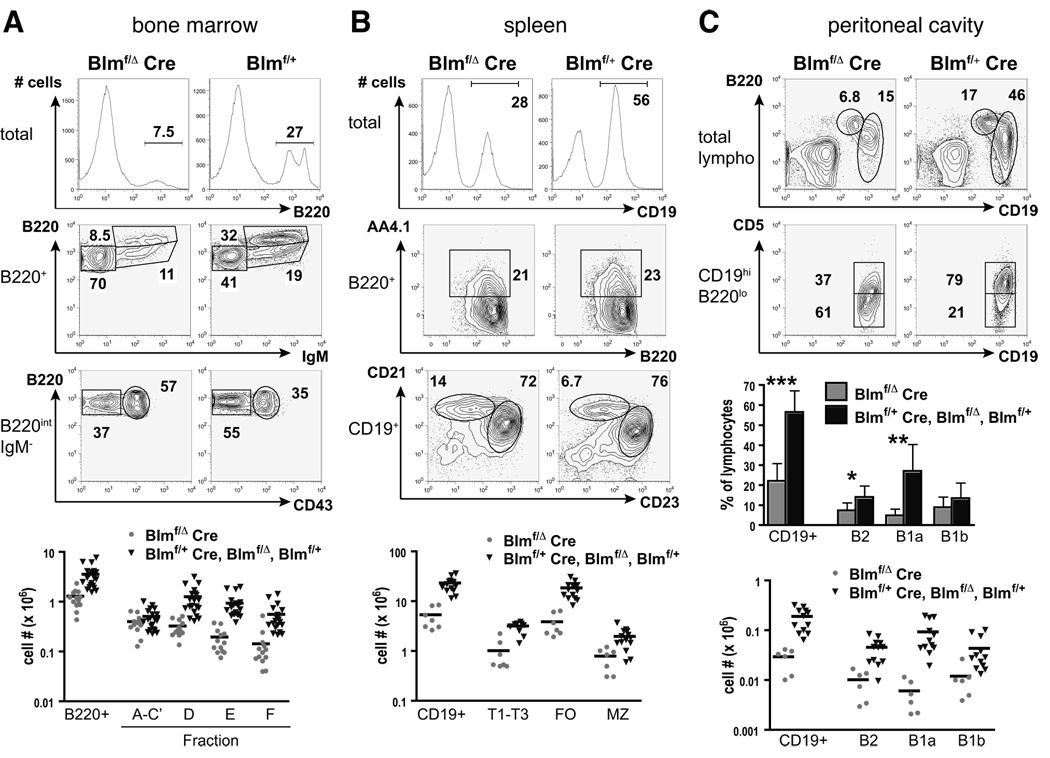
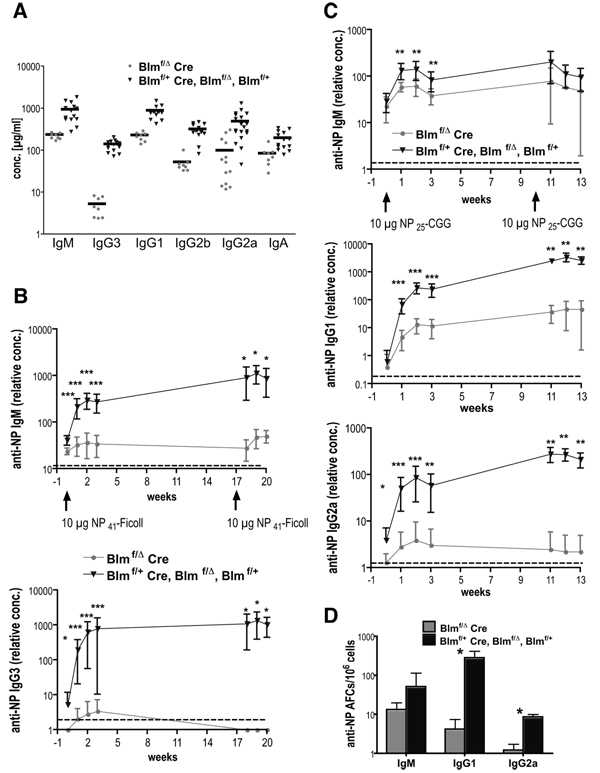
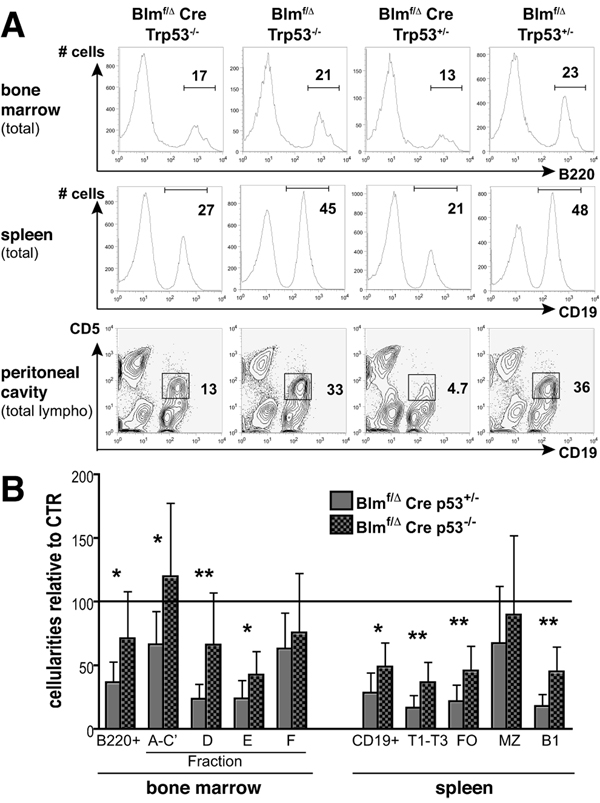
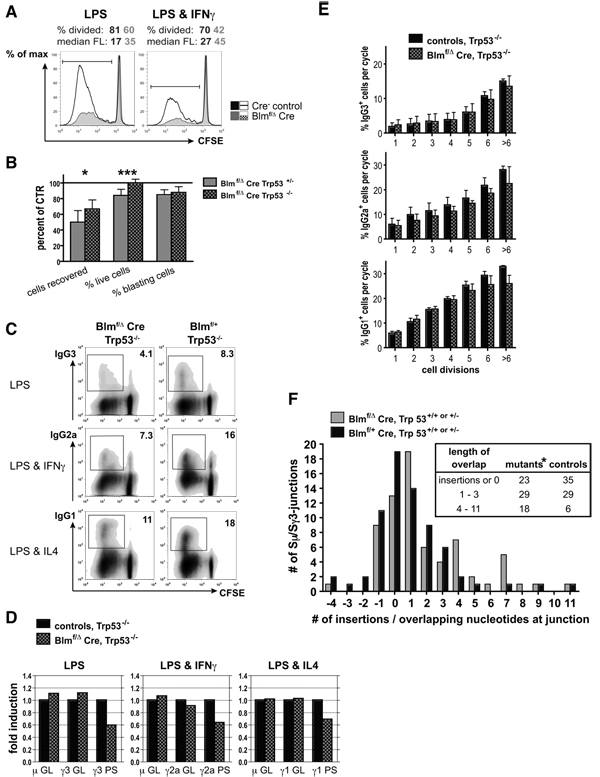
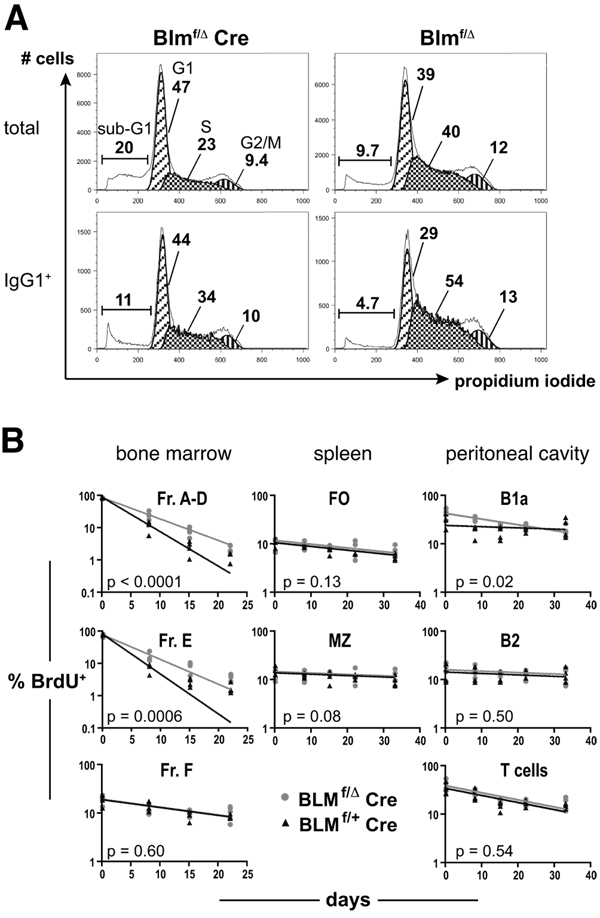
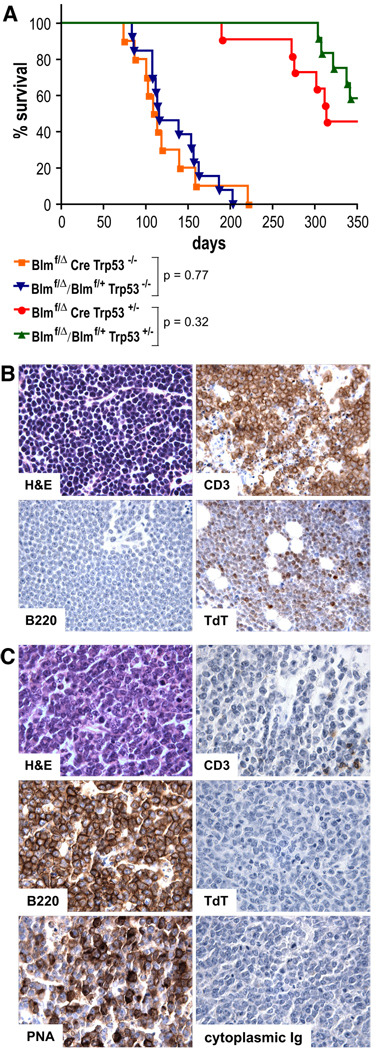
The RecQ family helicase BLM is critically involved in the maintenance of genomic stability, and BLM mutation causes the heritable disorder Bloom's syndrome. Affected individuals suffer from a predisposition to a multitude of cancer types and an ill-defined immunodeficiency involving low serum Ab titers. To investigate its role in B cell biology, we inactivated murine Blm specifically in B lymphocytes in vivo. Numbers of developing B lymphoid cells in the bone marrow and mature B cells in the periphery were drastically reduced upon Blm inactivation. Of the major peripheral B cell subsets, B1a cells were most prominently affected. In the sera of Blm-deficient naive mice, concentrations of all Ig isotypes were low, particularly IgG3. Specific IgG Ab responses upon immunization were poor and mutant B cells exhibited a generally reduced Ab class switch capacity in vitro. We did not find evidence for a crucial role of Blm in the mechanism of class switch recombination. However, a modest shift toward microhomology-mediated switch junction formation was observed in Blm-deficient B cells. Finally, a cohort of p53-deficient, conditional Blm knockout mice revealed an increased propensity for B cell lymphoma development. Impaired cell cycle progression and survival as well as high rates of chromosomal structural abnormalities in mutant B cell blasts were identified as the basis for the observed effects. Collectively, our data highlight the importance of BLM-dependent genome surveillance for B cell immunity by ensuring proper development and function of the various B cell subsets while counteracting lymphomagenesis.


Figures

FIGURE 1
FIGURE 1. Efficiency of Blm-deletion in Blmf/Δ Cre mice
Approximate fractions of cells deleted for Blm in selected lymphocyte populations from Blmf/Δ Cre (Δ) and Blmf/+ Cre control (C) mice as determined by semi-quantitative PCR. Bone marrow B220intCD43+IgM Fr. A-C’, B220intCD43IgM Fr. D, B220intIgM+ Fr. E, and B220hiIgM+ Fr. F, splenic CD19+CD23hiCD21+ FO and CD19+CD23loCD21hi MZ cells, peritoneal IgMCD5hi T, IgM+B220hiCD19lo B2 and IgM+B220loCD19hi B1 cells were sorted by cytometry and subjected to genomic PCR (pools of two mice per genotype). A 1:1 mixture of genomic DNA from cell lines harboring either only the floxed or the null Blm allele served as a reference (28). A repetition of the experiment yielded similar results.
FIGURE 2
FIGURE 2. Defective B cell development and reduced FO and B1 cell compartments in Blm-deficient mice
Flow cytometric analysis of bone marrow cells, splenocytes, and peritoneal lavage recovered from 6–10 week old Blmf/Δ, Cre and control mice. (A) Bone marrow cells from representative Blmf/Δ Cre and Blmf/+ mice were analyzed for expression of the indicated markers and percentages of cells within the respective gates are given. Total bone marrow cells are shown in the top, B220+ cells in the middle, and B220intIgM cells in the bottom row panels. Absolute numbers of bone marrow B220+ and Fr. A-F cells are displayed as scatter plots with each triangle representing an individual mouse and horizontal bars denoting the mean for each group (B220+ bone marrow cells: p = 2 × 10⁻⁵, B220intCD43+IgM Fr. A-C’: p = 0.14, B220intCD43IgM Fr. D: 4 × 10⁻⁵, B220intIgM+ Fr. E: 2 × 10⁻⁶, B220hiIgM+ Fr. F: 8 × 10⁻⁵; n = 13 for Blmf/Δ Cre mice and n = 20 for Blmf/+ Cre, Blmf/Δ and Blmf/+ controls). (B) Splenocytes from representive Blmf/Δ Cre and Blmf/+ Cre mice were analyzed for expression of the indicated markers to differentiate CD19+ B lymphocytes (% of total, top row panels), B220+AA4.1+ transitional (T1-T3) B cells (% of B220+, middle panels), CD19+CD23hiCD21+ FO, and CD19+CD23loCD21hi MZ B cells (% of CD19+, lower panels). Scatter plots depict absolute numbers of these populations (CD19+ cells: p = 3 × 10⁻⁷, T1-T3: 10−4, FO: p = 10−6, MZ: 5 × 10⁻⁴; n = 7 or 8 for Blmf/Δ Cre mice and n = 9–14 for controls). (C) Peritoneal exudate cells were analyzed to identify B220hiCD19lo B2 and B220loCD19hi B1 cells (upper contour plots). Analysis of CD5 expression on B220loCD19hi B1 cells revealed CD5int and CD5 B1a and B1b cells, respectively (lower contour plots). Bar diagrams show the average proportions (± SD) of total CD19+, B2, B1a, and B1b cells among peritoneal lymphocytes (*p < 0.05, **p < 0.005, ***p < 0.0005), and scatter plots display their absolute numbers (CD19+ cells: p = 10−4, B2: p = 4 × 10⁻⁴, B1a: p = 0.001, B1b: p = 0.009, n = 6 for Blmf/Δ Cre mice and n = 12 for controls).
FIGURE 3
FIGURE 3. Diminished immunoglobulin production in Blmf/Δ Cre mice
(A) Serum Ig isotype concentrations from 7–10 week old naive Blmf/Δ Cre (n = 8–13) and littermate control mice (n = 14–19) were measured by ELISA. Each data point represents an individual animal and horizontal bars denote mean concentrations for each group and isotype (IgM: p = 10−4, IgG3: p = 2 × 10⁻⁸, IgG1: p = 10−6, IgG2b: p = 10−6, IgG2a: p = 10−4, IgA: p = 0.001). (B) TI immune responses after primary and secondary immunizations. 12–17 week old Blmf/Δ Cre and control mice were intraperitoneally immunized with 10 µg NP41-Ficoll in PBS on weeks 0 and 17, and NP-specific serum IgM and IgG3 levels were determined after 0 (pre-immune), 1, 2, 3, 18, 19, and 20 weeks by ELISA. Average concentrations (± SD) for each group are expressed relative to a pool of reference sera that were immunized using the same protocol (n = 7–10 for sera collected after 0–3 and n = 4 for sera obtained after 18–20 weeks). Broken lines represent the detection limit of the ELISA (*p < 0.05, **p < 0.005, ***p < 0.0005 by Mann-Whitney test). (C) TD immune responses after primary and secondary immunizations. Cohorts of 11–19 week old Blmf/Δ Cre and control mice immunized i.p. with 10 µg NP25-CGG in alum on weeks 0 and 10 were bled on weeks 0, 1, 2, 3, 11, 12, and 13. NP-specific serum IgM, IgG1, and IgG2a titers were determined by ELISA and analyzed as in (B). For each group, seven and five mice were analyzed on weeks 0–3 and 11–13, respectively. (D) Frequencies (± SD) of NP-specific IgM-, IgG1-, and IgG2a-secreting AFCs in the bone marrow of four Blmf/Δ Cre and five control mice 12–13 weeks after secondary immunization with NP25-CGG as determined by ELISPOT. The mice were part of the cohort shown in (C). Statistical analysis was performed as in (B).
FIGURE 4
FIGURE 4. Partial rescue of B lineage compartments by p53-deficiency
(A) Nucleated bone marrow, splenic, and peritoneal lavage cells from p53-proficient or p53-deficient Blmf/Δ Cre and littermate control mice were analyzed for B220, CD19, as well as CD19 and CD5 expression. A representative set of results is shown. (B) Cellularities of the indicated B lineage populations from 7–11 week old Trp53+/− and Trp53−/− Blmf/Δ Cre mice are expressed as mean percentages (± SD) of the respective subsets from Trp53+/− and Trp53−/− control littermates (controls set to 100%, n = 5 or 6). Bone marrow populations were defined as in Fig. 2A and splenic compartments were: T1-T3: IgM+AA4.1+, FO: IgM+AA4.1CD23hiCD21+, MZ: IgM+AA4.1CD23loCD21hi and B1: IgM+AA4.1CD23loCD21. For calculation of SD values see the materials and methods section (*p < 0.05, **p < 0.005).
FIGURE 5
FIGURE 5. Impaired CSR in Blm-deficient B cells but no essential role for Blm in the mechanism of CSR
(A) CD43-depleted splenocytes from Blmf/Δ Cre (filled histograms) and control mice (open histograms, pool of two mice per genotype) were labeled with CFSE and cultured in the presence of LPS (left) or LPS and IFNγ (right) for four days to induce proliferation (and CSR), followed by FACS-analysis to detect CFSE-dilution. The percentages of cells that had divided at least once and the median CFSE fluorescence values are shown. The results are representative of three independent experiments for each set of stimuli. (B) Effects of p53-deficiency on cell survival and proliferative capacity of cultured B lymphocytes. Numbers of cells (as determined by enumeration of trypan blue excluding cells), fractions of live cells (as determined by cytometry and 7AAD exclusion, total events analyzed), and fractions of cell blasts (as determined by cytometric scatter analysis, gated on live cells) recovered after four days from Blmf/Δ Cre Trp53+/− and Blmf/Δ Cre Trp53−/− switch cultures are given as percentages (± SD) of controls. The graph includes data from eight to ten independent experiments in which B cells were stimulated with either LPS or LPS and IFNγ (*p < 0.05, ***p < 0.0005). (C) Representative cytometric analyses of CD43-depleted and CFSE-labeled splenocytes from Blmf/Δ Cre Trp53−/− and Blmf/+ Trp53−/− mice after four days of in vitro culture to detect CFSE dilution and surface expression of IgG3, IgG2a, and IgG1 upon stimulation with LPS (top), LPS and IFNγ (middle), and LPS and IL4 (bottom), respectively. Gates outline the populations of switched cells and numbers denote their frequencies. Events that appear positive for the respective IgG isotype, but fall outside of the indicated gate were found to be false-positive as determined by isotype control analysis. (D) Real-time RT-PCR for GL and PS sterile transcripts of S-regions in CD43-depleted B cells from Blmf/Δ Cre Trp53−/− and Trp53−/− control mice stimulated with LPS (μ and γ3, left), LPS and IFNγ (μ and γ2a, middle), and LPS and IL4 (μ and γ1, right) for two days. Mean expression levels in Blm-deficient B cells of three independent experiments are expressed as ‘fold induction’ relative to controls. (E) Fractions of switched cells after a specific number of cell divisions as determined by surface staining for IgG3, IgG2a and IgG1 expression and CFSE-dilution after four days of appropriate stimulation. Mean values (± SEM) representing the same three experiments as in (D) are shown. None of the differences in Blmf/Δ Cre Trp53−/− vs. Trp53−/− control cultures reached a level of statistical significance. (E) Microhomologies at switch recombination junctions from p53-proficient Blmf/Δ Cre and Blmf/+ Cre control mice. B cells were stimulated with LPS for four days as described in (C) and Sμ-Sγ3 junctions were amplified, subcloned, and sequenced. The number of nucleotides of uninterrupted Sμ donor/Sγ3 acceptor identity was determined by comparison to published Sμ and Sγ3 GL sequences. Sequences were compiled from two independent experiments employing Trp53+/+ and Trp53+/− B cells which yielded qualitatively similar results (n = 70 for each genotype). Negative numbers denote insertions at the breakpoint (*statistical significance for differences in distribution between mutants and controls in tabular insert: p = 0.01 by χ2 test).
FIGURE 6
FIGURE 6. Impaired viability and proliferative capacity of Blm-deficient B cells in vitro and abnormal turnover rates of several B cell populations in vivo in Blmf/Δ Cre mice
(A) Cell cycle analysis of in vitro activated B cells after CSR induction. CD43-depleted splenocytes from Blmf/Δ Cre and Blmf/Δ mice were stimulated with anti-CD40 antibody and IL4 for three days (with 50 ng/ml Colcemid added for the last 90 min of culture). The cells were subsequently stained for surface IgG1-expression and analyzed for determination of DNA content by flow cytometry. Histograms in the upper and lower rows depict PI incorporation of total and switched (IgG1+) cells, respectively. The results shown are representative of three independent experiments. (B) In vivo turnover of selected lymphocyte populations. Blmf/Δ Cre and Blmf/+ Cre mice were administered 0.8 mg/ml BrdU via the drinking water for two weeks (pulse period). On days 0, 8, 15, 22, 33 of the chase period cohorts of four mice per genotype were sacrificed and bone marrow (0, 8, 15, and 22 d time points only), splenic, and peritoneal exudate cells were analyzed for expression of appropriate surface markers to identify individual lymphocyte populations and BrdU incorporation by cytometry. Each data point corresponds to an individual mouse and solid lines represent trend lines describing the loss of BrdU+ cells (as fitted by non-linear regression). P-values comparing the slopes of the fitted curves are given for each population analyzed. Cell populations were defined as: bone marrow B220intIgM Fr. A-D, B220intIgM+ Fr. E, and B220hiIgM+ Fr. F, splenic B220+CD23hiCD21+ FO and B220+CD23loCD21hi MZ, and peritoneal B220intCD5int B1a, B220hiCD5 B2, and B220CD5hi T cells.
FIGURE 7
FIGURE 7. Survival of mice as a function of Blm- and p53-deficiency
(A) Kaplan-Meier survival plots representing percent survival of Blmf/Δ Cre Trp53−/− (n = 10), Cre control Trp53−/− (n = 13), Blmf/Δ Cre Trp53+/− (n = 11), and Cre control Trp53+/− (n = 12) mice vs. age. Adult mice were immunized with SRBCs twice at an interval of 4–5 weeks and sacrificed when in overtly sick condition. Each symbol represents an individual mouse at the time of its death and p values were calculated using the Mantel-Haenszel logrank test. (B) and (C) Histopathology and immunohistochemistry of representative tumors (1000×). (B) Thymic T cell lymphoma from a Blmf/+ Trp53−/− and (C) splenic B cell lymphoma from a Blmf/Δ Cre Trp53−/− mouse. Sections were stained with H&E, anti-CD3, anti-B220, anti-TdT, PNA, and anti-cytoplasmic Ig as indicated. Positive cells or nuclei (anti-TdT only) appear brown in the immunohistochemically stained sections.

References

    1. van Gent DC, Hoeijmakers JH, Kanaar R. Chromosomal stability and the DNA double-stranded break connection. Nat Rev Genet. 2001;2:196–206. - PubMed
    1. Gennery AR, Cant AJ, Jeggo PA. Immunodeficiency associated with DNA repair defects. Clin Exp Immunol. 2000;121:1–7. - PMC - PubMed
    1. Mills KD, Ferguson DO, Alt FW. The role of DNA breaks in genomic instability and tumorigenesis. Immunol Rev. 2003;194:77–95. - PubMed
    1. Ellis NA, Groden J, Ye TZ, Straughen J, Lennon DJ, Ciocci S, Proytcheva M, German J. The Bloom's syndrome gene product is homologous to RecQ helicases. Cell. 1995;83:655–666. - PubMed
    1. Bachrati CZ, Hickson ID. RecQ helicases: suppressors of tumorigenesis and premature aging. Biochem J. 2003;374:577–606. - PMC - PubMed

Publication types

MeSH terms