. 2009 Jan 1;182(1):398-407.
doi: 10.4049/jimmunol.182.1.398.

Influence of B cell antigen receptor expression level on pathways of B cell tolerance induction

Affiliations

Influence of B cell antigen receptor expression level on pathways of B cell tolerance induction

Xiaohe Liu et al. J Immunol. .

Abstract

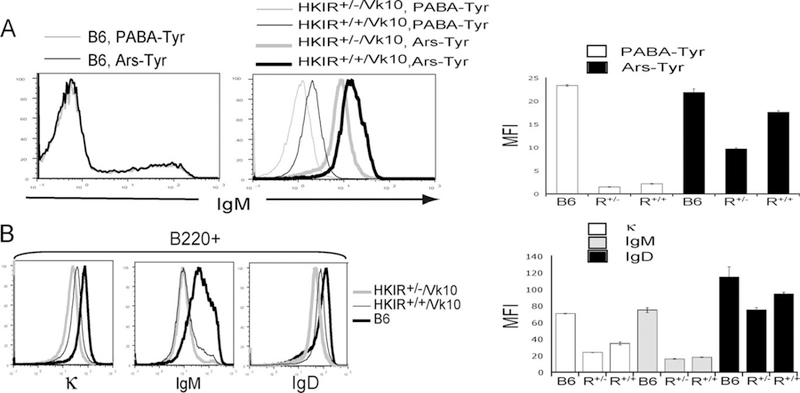
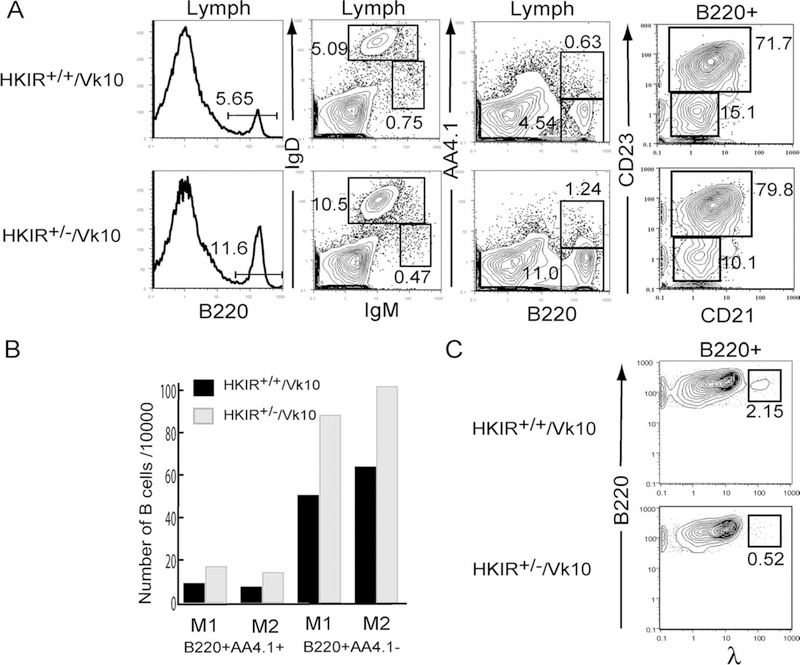
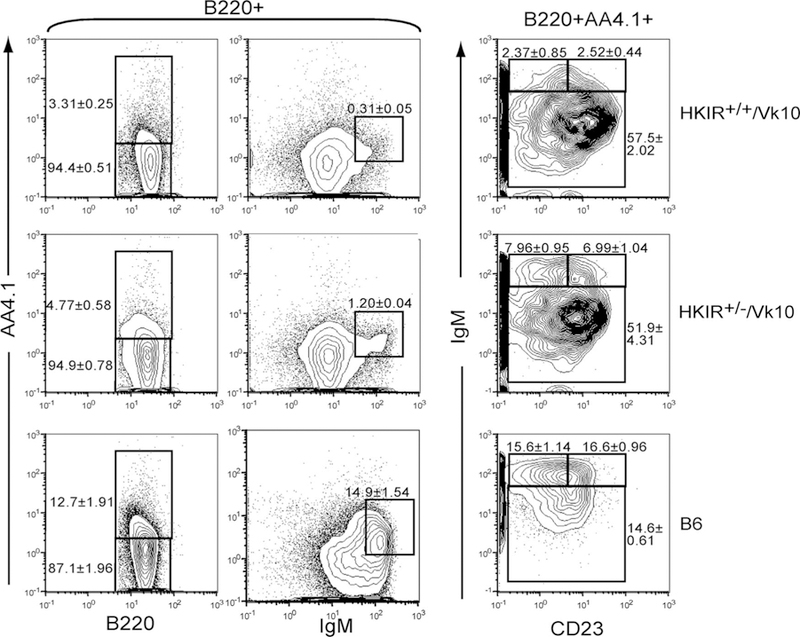
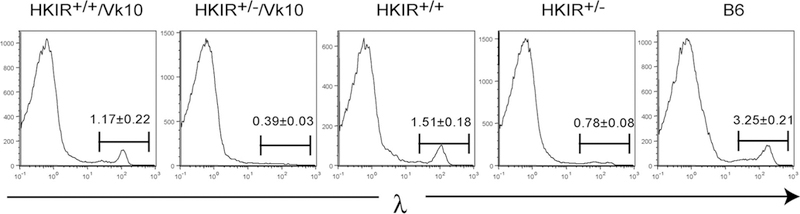
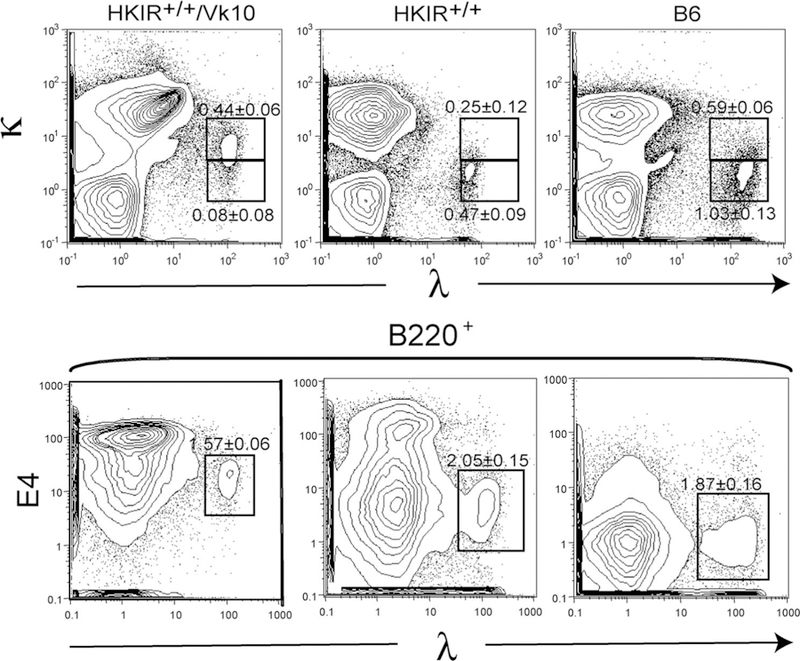
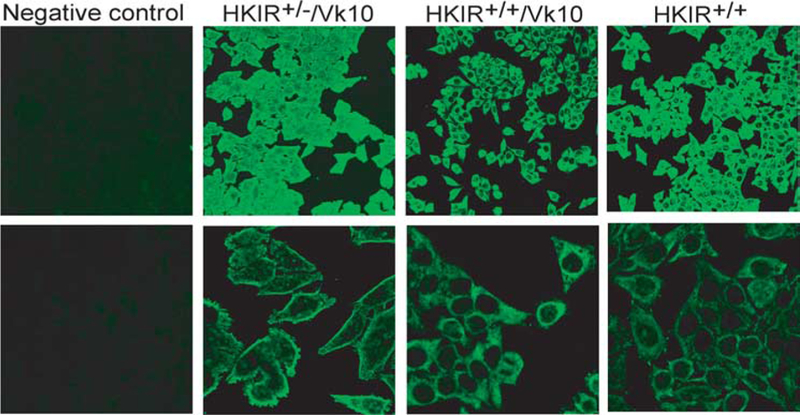
We have described an Ig-transgenic, autoreactive B cell clonotype that undergoes a novel tolerance pathway. Early in development this clonotype expresses average BCR levels, but these levels are progressively down-regulated as development proceeds efficiently to the mature, follicular compartment. This clonotype does not display conventional features of anergy and can be induced to undergo apoptosis and receptor editing in in vitro bone marrow cultures, but these pathways are not taken in vivo. These data suggested that autoantigen-driven down-regulation of BCR levels and, hence, avidity for autoantigen allows this clonotype to bypass conventional tolerance mechanisms. To test this idea, we enforced elevated levels of expression of BCR in this clonotype by making the transgenic Igh locus homozygous. This resulted in retarded clonotype development and L chain receptor editing in vivo. These data support a pivotal role for adaptive, autoantigen-induced adjustment of BCR expression levels in the regulation of primary B cell development and tolerance.


Figures

FIGURE 1
FIGURE 1
Surface BCR levels on B cells in HKIR+/+/Vκ10 mice and in BM cultures. A, Immature B cells from day 5 cultures of HKIR+/+/Vκ10 BM (R+/+), HKIR+/−/Vκ10 BM (R+/−), or C57BL/6 (B6) BM containing either Ars-Tyr or p-aminobenzoic acid (PABA)-Tyr (0.1 mM) were analyzed for sIgM levels via flow cytometry. The right panel shows the mean fluorescence intensity (MFI) of sIgM levels on sIgM cells illustrated in the left panels. These data were obtained using a fluorochrome-labeled intact allotype-nonspecific anti-IgM reagent and indicated that HKIR+/+/Vκ10 B cells in BM cultures containing Ars-Tyr express 1.5–1.7-fold more sBCRs than HKIR+/−/Vκ10 B cells in analogous cultures. When the analysis was done with a Fab anti-IgM reagent, this value was 1.8-fold (data not shown). B, Splenic B220 cells from the indicated mice were analyzed for surface levels of BCR via flow cytometry using allotype-nonspecific anti-κ, anti-IgM, and anti-IgD Abs. Overlays of staining intensity on splenic B cells from these mice are shown. The right panel shows the mean fluorescence intensities of the staining patterns illustrated in the left panel. Figures are representative of data obtained from at least four mice of each genotype in multiple experiments.
FIGURE 2
FIGURE 2
Retarded B cell autoreconstitution in HKIR+/+/Vκ10 mice. Mice of the indicated genotypes were given 550 rad whole-body irradiation, allowed to autoreconstitute for 4 wk, and then spleen cells were isolated, stained with mAbs specific for the indicated markers, and analyzed by flow cytometry. A, Percentages of B cells in these mice in the indicated gates are shown. B, The absolute number of mature and transitional B cells in each spleen sample were calculated from the data shown in A. C, Percentages of B220+λ+ B cells in the spleens of the indicated types of mice are shown. Data in A and C are representative of those obtained from two mice of each genotype. All of these data are illustrated in B. The data in A were used to generate the values illustrated in B.
FIGURE 3
FIGURE 3
Reduction of T1 and T2 transitional B cells in HKIR+/+/Vκ10 mice. Splenic B cells from mice of the indicated genotypes were stained with Abs specific for the indicated markers and analyzed by four- color flow cytometry. The percentage of cells in each fraction are indicated next to the gates. The data are representative of at least three mice per experiment and multiple experiments.
FIGURE 4
FIGURE 4
HKIR+/+/Vκ10 and HKIR+/+ mice contain elevated levels of λ-expressing B cells. Spleen cells from mice of the indicated genotypes were stained with anti-λ Abs and analyzed by flow cytometry. Gates are set on the λ+ subpopulations and the percentages of these cells of total splenocytes are indicated. The few λ+ B cells present in HKIR+/− mice mainly express the nontransgenic Igh (IgMb) allele (data not shown). The data were derived from at least three mice of each genotype.
FIGURE 5
FIGURE 5
L chain isotypic inclusion in λ+ B cells in HKIR+/+/Vκ10 mice. Spleen cells from mice of the indicated genotypes were stained with anti-κ and anti-λ Abs (upper panels) and anti-B220, anti-λ and E4 Abs (lower panels), and analyzed by flow cytometry. Major subpopulations of λ+ B cells are gated. All data are representative of multiple experiments using at least three mice per genotype.
FIGURE 6
FIGURE 6
The λ-κ double-positive B cells in HKIR+/+ mice have MZ-like phenotypes. A, Spleen cells from mice of the indicated genotypes were stained with an anti-λ Ab as well as Abs specific for IgM and IgD and analyzed by flow cytometry. Panels show data obtained for cells gated on λ staining. Gates are set around areas expected to contain FO (left) or MZ (right) B cells, although the gates set for HKIR+/+/Vκ10 and HKIR+/+ cells do not exactly correspond to those in the B6 panel due to the unusual BCR expression levels of the former B cells. B, Upper panels, spleen cells from mice of the indicated genotypes were stained with Abs specific for B220, CD1d, and λ and analyzed by flow cytometry. Gates are set around areas expected to contain largely MZ (upper gates) or FO (lower gate) B cells. B, Lower panels, splenic B cells from the indicated mice were stained with an anti-λ Ab as well as Abs specific for CD21 and CD23 and analyzed by flow cytometry. Panels show data obtained for cells gated on λ staining. Gates are set around areas expected to contain FO (left) or MZ (right) B cells, although the MZ-like cells in HKIR+/+/Vκ10 and HKIR+/+ mice express higher levels of CD23 than those in B6 mice. All data are representative of those obtained from at least two experiments using three or more mice per experiment.
FIGURE 7
FIGURE 7
Most λ+ splenic B cells in HKIR+/+/Vκ10 mice reside in the MZ. Spleen sections from mice of the indicated genotypes were stained with MOMA-1-FITC and anti-λ-PE and digital images were captured by immunofluorescence microscopy. MOMA-1 staining defines the border of the B cell follicle and the MZ. Original magnification, × 200. The intensely staining λ+ cells in HKIR+/−/Vκ10 spleens was reproducibly observed and appears to be plasma cells located in the red pulp. We currently have no explanation for the presence of these cells in this mouse line. The data are representative of those obtained from at least three mice per genotype.
FIGURE 8
FIGURE 8
λ+ B cells from HKIR+/+/Vκ10 mice respond to Ars-KLH immunization in vivo. FACS-purified λ+ and λ splenic B cells from HKIR+/+/Vκ10 mice were transferred to recipient C57BL/6.CD45.1 mice that were immunized (i.p.) 12 h later with 100 μg of Ars-KLH in alum. Mice were sacrificed on day 6 after transfer and immunization, and splenocytes were stained with Abs specific for the indicated markers and analyzed by three-color flow cytometry. Gated percentages represent peanut agglutinin-positive (PNA+), CD45.2+ GC B cells. The data are representative of two experiments.
FIGURE 9
FIGURE 9
λ L chain-containing mAbs from HKIR+/+/Vκ10 and HKIR+/+ mice have little nuclear staining activity. Slides coated with fixed Hep-2 cells were stained with mAbs produced by IgM, λ-expressing hybridomas generated from the indicated mice and counterstained with a FITC-labeled anti-IgM Ab. Digital images were captured on a fluorescence microscope. Dilutions of culture supernatants containing equivalent amounts of IgM (determined by ELISA) from each hybridoma were used. Upper panels, × 200 original magnification; lower panels, × 630 original magnification. The staining patterns are representative of all IgM-λ-expressing hybridomas isolated from the indicated strains of mice.

References

    1. Goodnow CC 1992. Transgenic mice and analysis of B-cell tolerance. Annu. Rev. Immunol 10: 489–518. - PubMed
    1. Nemazee D 2000. Receptor editing in B cells. Adv. Immunol 74: 89–126. - PubMed
    1. Gay D, Saunders T, Camper S, and Weigert M. 1993. Receptor editing: an approach by autoreactive B cells to escape tolerance. J. Exp. Med 177: 999–1008. - PMC - PubMed
    1. Tiegs SL, Russell DM, and Nemazee D. 1993. Receptor editing in self-reactive bone marrow B cells. J. Exp. Med 177: 1009–1020. - PMC - PubMed
    1. Nossal GJ 1993. Tolerance and ways to break it. Ann. NY Acad. Sci 690: 34–41. - PubMed

Publication types

MeSH terms