. 2008 Dec 23;1(51):ra17.
doi: 10.1126/scisignal.1164795.

Type I IL-4Rs selectively activate IRS-2 to induce target gene expression in macrophages

Affiliations

Type I IL-4Rs selectively activate IRS-2 to induce target gene expression in macrophages

Nicola M Heller et al. Sci Signal. .

Abstract

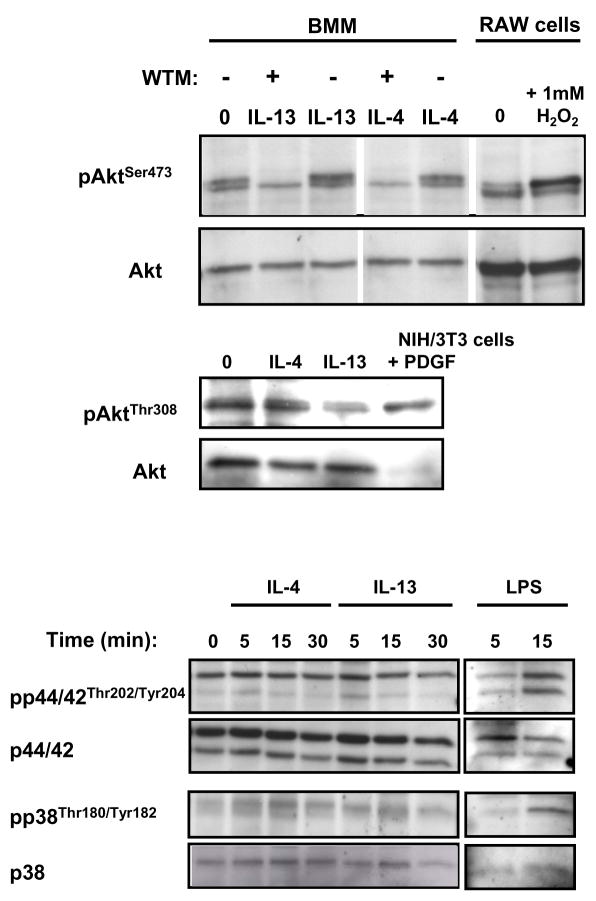
Although interleukin-4 (IL-4) and IL-13 participate in allergic inflammation and share a receptor subunit (IL-4Ralpha), they have different functions. We compared cells expressing type I and II IL-4Rs with cells expressing only type II receptors for their responsiveness to these cytokines. IL-4 induced highly efficient, gammaC-dependent tyrosine phosphorylation of insulin receptor substrate 2 (IRS-2), whereas IL-13 was less effective, even when phosphorylation of signal transducer and activator of transcription 6 (STAT6) was maximal. Only type I receptor, gammaC-dependent signaling induced efficient association of IRS-2 with the p85 subunit of phosphoinositide 3-kinase or the adaptor protein growth factor receptor-bound protein 2. In addition, IL-4 signaling through type I IL-4Rs induced more robust expression of a subset of genes associated with alternatively activated macrophages than did IL-13. Thus, IL-4 activates signaling pathways through type I IL-4Rs qualitatively differently from IL-13, which cooperate to induce optimal gene expression.


Figures

Fig. 1
Fig. 1
Abundance of receptor chains on U937 and THP-1 cells. Equivalent numbers of cells were incubated with specific antibodies (filled histograms) against human γC, IL-4Rα, IL-13Rα1, and IL-13Rα2 or with the corresponding isotype-matched controls (open histograms) as indicated and were analyzed by flow cytometry. Representative histogram plots from one experiment for each receptor subunit are shown. The mean fluorescence intensity of the positive peaks are shown.
Fig. 2
Fig. 2
IL-4 and IL-13 signaling through the type I and type II IL-4 receptors in U937 and THP-1 cells. (A) U937 and THP-1 cells were treated with various concentrations of human IL-4 or IL-13, as indicated, for 30 minutes. Cell lysates were prepared and used in immunoprecipitation assays with anti-STAT6 or anti-IRS-2 antibodies, which were analyzed by Western blotting with anti-phosphotyrosine antibodies. After stripping, the blots were incubated with anti-STAT6 or anti-IRS-2 antibodies, as indicated. Autoradiograms of a representative experiment out of 3 independent experiments are shown. (B) Autoradiograms shown above in A were scanned and densitometry was performed on the bands with NIH Image software. The relative densities of bands corresponding to phosphorylated proteins were divided by the densities of bands corresponding to total proteins, as indicated. (C) U937 and THP-1 cells were treated with increasing concentrations of IL-4 or 100 ng/mL IGF-I for 30 minutes, as indicated. For IRS-2, cell lysates were analyzed as described for panel A. For analysis of STAT6, Western blots of total lysates were incubated with antiphospho-STAT6-Tyr641 antibody. After stripping, the blots were incubated with anti-STAT6 antibody. The gap in the U937 blot (left-hand side) indicates other lanes on the SDS-PAGE gel that are not shown here. The samples are from the same exposure of the same blot. Autoradiograms of a representative experiment out of 2 independent experiments are shown.
Fig. 3
Fig. 3
Ectopic expression of γC in THP-1 cells. (A) THP-1 cells were transfected with linearized plasmids encoding the human γC gene and neomycin resistance to allow selection of positive clones in media containing G418. Following 8 weeks of selection, clones were screened for the presence of surfaceγC by incubation with antibodies against human γC (filled histograms) or isotype-matched controls (open histograms) and were compared to the parental THP-1 cell line by flow cytometry. The mean fluorescence intensity (MFI) of the anti-γC-PE-stained sample is indicated in the upper right corner of each plot. (B) U937, THP-1, and THP-1 cells expressing human γC were treated with human IL-4 (10 ng/mL) as indicated for 30 minutes. Cell lysates were prepared and samples were immunoprecipitated with anti-IRS-2 or anti-STAT6 antibodies. Western blots were incubated with anti-phosphotyrosine antibodies. After stripping, the blots were incubated with anti-STAT6 or anti-IRS-2 antibodies, as indicated. Autoradiograms of a representative experiment out of 3 independent experiments are shown. Several molecular weight species of STAT6 commonly observed in macrophage cell lines are visible. Autoradiograms shown above were scanned and densitometry was performed on the major bands using NIH Image software. The relative densities of bands corresponding to phosphorylated proteins were divided by those corresponding to total proteins and the value is shown under the blots. (C) U937 and two THP-1 clones expressing human γC were treated with human IL-4 (10 ng/mL), human IL-13 (10 ng/mL), or human IGF-I (100 ng/mL) as indicated for 30 minutes. Analysis of phospho-IRS-2 and phospho-STAT6 was carried out as described in Fig. 2C. Densitometric analysis on autoradiograms was performed as described in the Materials and Methods and the data were expressed as a percentage of the maximal response for each cell type or clone. In this experiment the IGF-1-induced tyrosine phosphorylation of IRS-2 in U937 cells was weaker than usual as compared to the IL-4-induced response.
Fig. 4
Fig. 4
Signaling in response to IL-4 and IL-13 in WT and γC−/− BMMs. (A) BMM were isolated and cultured from WT C57BL/6 and γC−/− mice as described in Materials and Methods. After ten days, the cells were stimulated with 20 ng/mL IL-4 or IL-13 for 30 minutes and cell lysates were collected and analyzed for IRS-2 and STAT6 phosphorylation as described in Fig. 1. Representative Western blot films are shown from a total of more than four independent experiments. (B) Densitometric analysis of Western blot films. Densitometric analysis was performed as described in Figure 1B. The amount of normalized phosphoprotein measured in response to IL-4 was set as the maximal response (= 100 %). n = 4, * P < 0.05. C. Western blot films showing IRS-2 phosphorylation in response to IGF-I in WT and γC−/− BMM. Cells were stimulated with 100 ng/mL mIGF-I or 20 ng/mL IL-4 and IL-13 and were analyzed for IRS-2 phosphorylation as described in Fig. 1.
Fig. 5
Fig. 5
Analysis of phosphoproteins in WT BMMs. (A) BMMs were isolated from WT C57BL/6 mice and cultured as described in Materials and Methods. After ten days, the cells were stimulated with IL-4 or IL-13 (20 ng/mL) for 30 minutes and cell lysates were collected and analyzed for IRS-2 and STAT6 phosphorylation by immunoprecipitation and Western blotting as described for Fig. 1. (B) BMMs were treated with various concentrations of IL-4 or IL-13 for 30 minutes. The analysis of tyrosine phosphorylation of IRS-2 and STAT6 was performed using the following methods: Graph 1 - densitometric analysis of IRS-2 phosphorylation by immunoprecipitation followed by analysis of Western blots with an anti-phosphotyrosine antibody. Graph 2 - densitometric analysis of pSTAT6 in total cell lysates by Western blotting with phospho-specific anti-STAT6 antibodies. Graph 3 - analysis of pSTAT6 by intracellular flow cytometry with PE-conjugated anti-pSTAT6 antibodies. These graphs are representative of 3 independent experiments.
Fig. 6
Fig. 6
Association of pIRS-2 with the p85 subunit of PI3K and Grb2. (A) BMMs were isolated from WT C57BL/6 and γC−/− mice and cultured as described above. After ten days, the cells were stimulated with IL-4 or IL-13 (20 ng/mL) for 30 minutes and cell lysates were collected and precipitated with anti-IRS-2, anti-p85, or anti-Grb2 antibodies as indicated. Western blots were incubated with anti-phosphotyrosine antibody. The region of the blot containing the 180 kD, pIRS-2 is shown. The blots were stripped and incubated with anti-IRS-2, anti-p85 or anti-Grb2 antibodies as shown. (B) Densitometric quantitation of the phosphotyrosine Western blots shown in panel A. These data are representative of 3 independent experiments.
Fig. 7
Fig. 7
Analysis of downstream phosphorylation. (A) BMMs were isolated from WT C57BL/6 mice and cultured as described above. After ten days, the cells were stimulated with IL-4 or IL-13 (100 ng/mL) or LPS (100 ng/ml) for various times as indicated and cell lysates were collected. Where indicated the BMM were pre-treated with wortmannin as described in Materials and Methods. RAW264.7 macrophages were treated with 1 mM H2O2 for 15 minutes and used as a positive control. Western blots were probed with phosphospecific antibodies as indicated. The blots were stripped and reprobed for total protein as appropriate. These data are representative of 3 independent experiments.
Fig. 8
Fig. 8
Induction of expression of genes characteristic of alternatively activated macrophages by IL-4 and IL-13 in WT and γC−/− BMM. (A) BMMs were isolated from WT C57BL/6 and γC−/− mice as described in the Materials and Methods. After ten days, cells were stimulated with 100 ng/mL IL-4 (black bars) or IL-13 (hatched bars) for 6 and 24 hours and total RNA was harvested. Complementary DNA was generated and real-time RT-PCR analysis was performed with specific primers for the named genes. The results are expressed as the fold-induction (2−ΔΔCt) of a given mRNA in cytokine-treated cells compared to that of unstimulated cells and normalized to HPRT, a housekeeping gene. The top panels show a representative of 3–5 individual experiments. The standard errors for the qPCR plate replicates were too small to appear on the graphic representation. In the bottom bar graphs, the average data from multiple individual experiments were expressed as a percentage of maximal induction (IL-4-stimulated value = 100%) at 24 hours. n = 3 – 5, * P < 0.05, ** P < 0.01, † P < 0.005, ‡ P < 0.001. (B) Production of arginase I and Ym1 protein in WT and γC knockout mice. Total cell lysates were harvested at the time points indicated and were analyzed by Western blotting as described in the Materials and Methods.
Fig. 9
Fig. 9
Effect of wortmannin on the induction of FIZZ1, Ym1, and arginase 1 by IL-4. BMMs were isolated from WT C57BL/6 mice as described above. After ten days, the cells were treated with (filled circles) or without (open circles) 100 nM wortmannin for twenty minutes and were then stimulated with 100 ng/mL IL-4 or IL-13 (open triangles). Total RNA was harvested at six and 24 hours. cDNA was generated and real-time RT-PCR analysis with specific primers for the named genes was performed. The results are expressed as the fold-induction (2−ΔΔCt) of each specific mRNA in cytokine-treated cells compared to that of unstimulated cells and normalized to HPRT, a housekeeping gene. A representative experiment of two independent experiments is shown.

Similar articles

Cited by

References

    1. Boulay JL, Paul WE. The interleukin-4 family of lymphokines. Curr Opin Immunol. 1992;4:294–298. - PubMed
    1. Sprang SR, Bazan JF. Cytokine structural taxonomy and mechanisms of receptor engagement. Curr Opin Struct Biol. 1993;3:815–827.
    1. Rozwarski DA, Gronenborn AM, Clore GM, Bazan JF, Bohm A, Wlodawer A, Hatada M, Karplus PA. Structural comparisons among the short-chain helical cytokines. Structure. 1994;2:159–173. - PubMed
    1. Minty A, Chalon P, Derocq JM, Dumont X, Guillemot JC, Kaghad M, Labit C, Leplatois P, Liauzun P, Miloux B, et al. Interleukin-13 is a new human lymphokine regulating inflammatory and immune responses. Nature. 1993;362:248–250. - PubMed
    1. Chomarat P, Banchereau J. Interleukin-4 and interleukin-13: their similarities and discrepancies. Int Rev Immunol. 1998;17:1–52. - PubMed

Publication types

MeSH terms

Substances