

doi: 10.1128/JVI.01841-08.
Epub 2008 Dec 24.
Gag p27-specific B- and T-cell responses in Simian immunodeficiency virus SIVagm-infected African green monkeys
Affiliations
- PMID: 19109377
- PMCID: PMC2648264
- DOI: 10.1128/JVI.01841-08
Item in Clipboard
Gag p27-specific B- and T-cell responses in Simian immunodeficiency virus SIVagm-infected African green monkeys
J Virol.
2009 Mar.
Abstract
Nonpathogenic simian immunodeficiency virus SIVagm infection of African green monkeys (AGMs) is characterized by the absence of a robust antibody response against Gag p27. To determine if this is accompanied by a selective loss of T-cell responses to Gag p27, we studied CD4(+) and CD8(+) T-cell responses against Gag p27 and other SIVagm antigens in the peripheral blood and lymph nodes of acutely and chronically infected AGMs. Our data show that AGMs can mount a T-cell response against Gag p27, indicating that the absence of anti-p27 antibodies is not due to the absence of Gag p27-specific T cells.
Figures
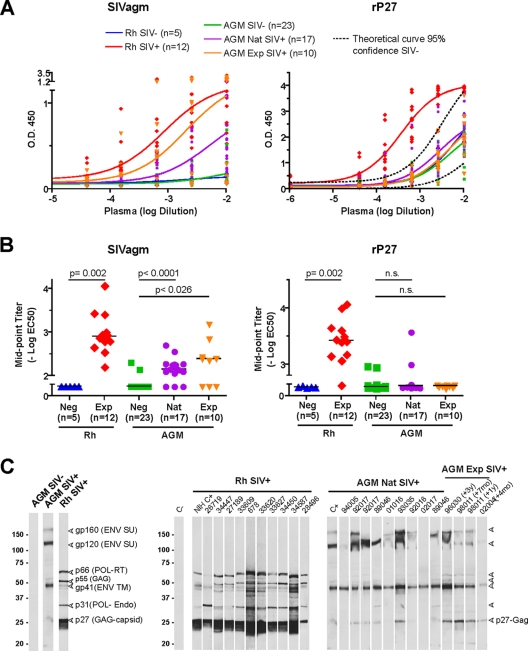
Cross-sectional analysis of IgG Ab responses against SIVagm or Gag p27 in SIV-infected AGMs and RMs. (A and B) Cross-sectional analysis by ELISA. IgG Ab against SIVagm.sab92018 virions or recombinant p27-Gag antigens were determined in SIV-negative (Rh SIV−) and chronically SIVmac251-infected (Rh SIV+) RMs and in SIV-negative and chronically SIVagm-infected AGMs that were either naturally (AGM Nat SIV+) or experimentally (AGM Exp SIV+) infected with SIVagm.sab92018. Ab titers were calculated for each animal by limited dilution of plasma on coated ELISA plates with 5 μg/ml of (p27 equivalent) virions (left) or 1 μg/ml of the monomeric recombinant protein (rP27) (right). IgG detection by ELISA displayed a high background for rP27, especially at the highest plasma concentration (e.g., 1/100 and 1/400 plasma dilution) in SIV-negative RMs and AGMs. To discriminate between positive responses and background, calculated dose-response curves were compared to theoretical sigmoid-dose response curves corresponding to the 95% confidence interval of SIV-negative animals. By convention, responses were considered background when sigmoid dose-response curves were graphically within the 95% confidence interval of SIV-negative animals and when the calculated negative log 50% effective concentration (EC50) was lower than the top theoretical sigmoid dose-response curve from SIV-negative animals (corresponding to a threshold of negative log EC50 of 2.8). (A) Results (optical density at 450 nm [OD450]) are represented for both virions (left) and rP27 (right) over plasma dilution (log10) on a per animal basis (data points) and for each group (lines). Lines represent the sigmoid dose-response curves for each group (Prism 4; Graphpad). (B) Mid-point IgG titers were determined for each animal from individual sigmoid dose-response curves, and presented as the log10 value from the reciprocal of the effective concentration that corresponds to 50% response between minimum and maximum OD450 (negative log EC50). Horizontal bars represent the median mid-point titer per each group. Mann-Whitney nonparametric tests were applied for statistical analysis (n.s., nonsignificant, with P values of >0.1) (C) Cross-sectional analysis of Ab against SIVagm proteins by Western blot analysis using denatured SIVagm.sab92018. For the positive controls on the left, we used sera from an SIVmac251-infected macaque and a SIVagm.sab92018-infected AGM. Development times and reagents were identical for all Western blots. Mo, months of infection; y, years of infection; C−, negative control; C+, positive control.
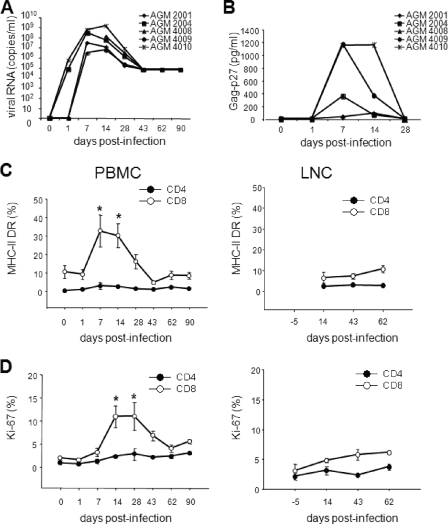
Plasma viremia and T-cell activation in blood and LNs of five longitudinally followed SIVagm.sab92018-infected African green monkeys. (A) SIVagm.sab RNA copy numbers in plasma. (B) Plasma Gag p27 concentrations. (C) Percentages of MHC-II DR-positive CD4+ (•) and CD8+ (○) T cells within, respectively, total CD4+ and CD8+ T cells from PBMCs and LNCs. (D) Percentages of Ki-67+ CD4+ (•) and CD8+ (○) T cells within, respectively, total CD4+ and CD8+ T cells from PBMCs and LNCs. Results are shown as the mean ± the standard error of the mean. Asterisks indicate statistically significant differences compared to levels before infection (P < 0.05).
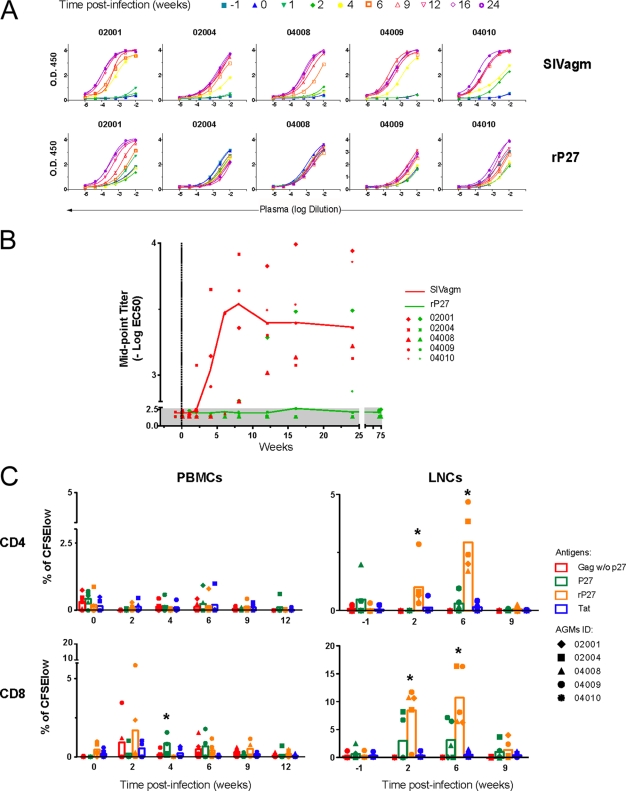
Longitudinal analysis of IgG titers and T-cell proliferative responses against SIVagm and Gag p27 in five AGMs experimentally infected with SIVagm.sab92018. (A and B) Ab responses were analyzed by ELISA. (A) IgG dose-response curves against SIVagm (top) and rP27 (bottom) are shown over time (week −1 to week 24 p.i.). O.D.450, optical density at 450 nm. (B) Mid-point titers were calculated as described in the legend to Fig. 1A. Continuous lines correspond to median titers from all five animals. Red, anti-SIVagm IgGs; green, anti-p27 IgGs. (C) Proliferative responses of CD4+ and CD8+ T cells were assessed by flow cytometry using carboxy fluorescein succinimidyl ester staining (CFSE). CD4+ and CD8+ T-cell responses in PBMCs (left) and LNCs (right) after stimulation with peptide pools (Gag without P27, P27, and Tat) and Gag rP27 are shown for each animal. All data are reported after background subtraction. Results are presented in columns as the mean ± the standard error of the mean. Asterisks indicate statistically significant differences compared to individual values before infection (P < 0.05).
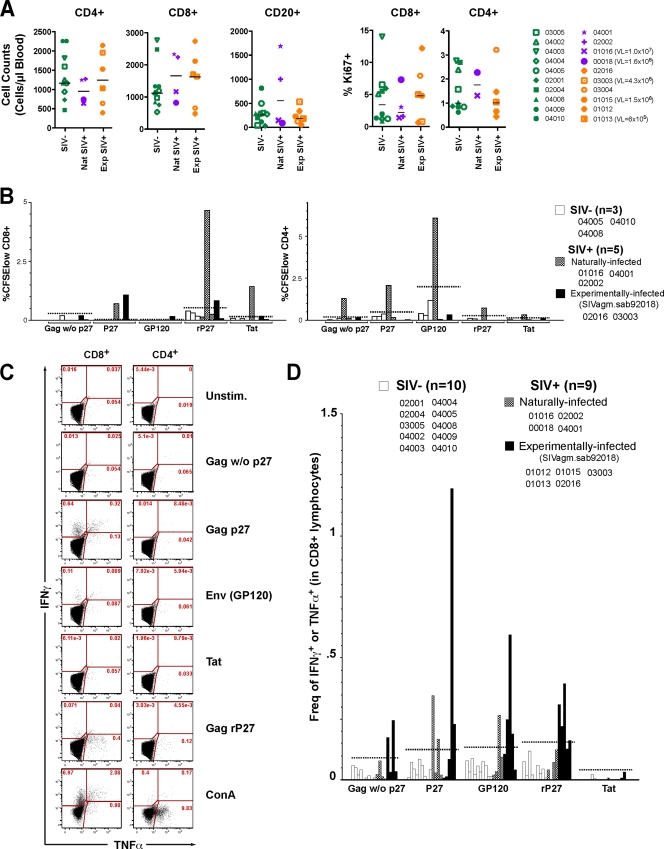
Immune parameters and SIVagm-specific proliferative and cytokine T-cell responses in chronically infected AGMs. (A) Cell counts (CD4+ and CD8+ T cells; B cells) and immune activation levels (percent of Ki-67+ in CD4+ and CD8+ T cells) in AGMs (n = 4) naturally infected with SIVagm (Nat SIV+) and AGMs (n = 6) experimentally infected with SIVagm.sab92018 (Exp SIV+) compared to uninfected AGMs (n = 10) (SIV−). PVL, if known, is indicated. Green, blue, and orange symbols correspond, respectively, to noninfected, naturally infected, and experimentally infected AGMs. (B) Proliferative response to SIVagm antigens in chronically infected AGMs (n = 5) compared to those in uninfected AGMs (n = 3). PBMCs were stimulated with the same antigens as those described in the legend to Fig. 3. (C) Analysis of cytokine responses (gamma interferon [IFN-γ] and tumor necrosis factor alpha [TNF-α]) by SIVagm-specific T cells. ConA was used as a positive control. Representative results from a single animal are shown here. (D) Cumulative values of SIVagm-specific TNF-α and IFN-γ responses in chronically infected animals. The responses to SIVagm antigens were analyzed in peripheral blood specimens of 4 naturally and 5 experimentally infected AGMs as well as 10 uninfected AGMs. The data are reported after background subtraction corresponding to the subtraction of the frequency of positive events from the unstimulated samples to the frequency of positive events from the antigen-specific stimulation. Proliferative T-cell responses and cytokine T-cell responses in SIV-infected AGMs were defined as positive when higher than 3 standard deviations above the mean responses for uninfected animals. Freq, frequency; w/o, without.
Similar articles
-
Simian immunodeficiency virus SIVagm.sab infection of Caribbean African green monkeys: a new model for the study of SIV pathogenesis in natural hosts.J Virol. 2006 May;80(10):4858-67. doi: 10.1128/JVI.80.10.4858-4867.2006. J Virol. 2006. PMID: 16641277 Free PMC article.
-
CD8+ T lymphocytes of African green monkeys secrete an immunodeficiency virus-suppressing lymphokine.Proc Natl Acad Sci U S A. 1994 Jul 19;91(15):7207-11. doi: 10.1073/pnas.91.15.7207. Proc Natl Acad Sci U S A. 1994. PMID: 7913749 Free PMC article.
-
Experimental depletion of CD8+ cells in acutely SIVagm-infected African Green Monkeys results in increased viral replication.Retrovirology. 2010 May 11;7:42. doi: 10.1186/1742-4690-7-42. Retrovirology. 2010. PMID: 20459829 Free PMC article.
-
The role of the immune response during SIVagm infection of the African green monkey natural host.Front Biosci. 2004 Jan 1;9:550-64. doi: 10.2741/1219. Front Biosci. 2004. PMID: 14766390 Review.
-
SIVagm infection of its natural African green monkey host.Immunol Lett. 1996 Jun;51(1-2):53-8. doi: 10.1016/0165-2478(96)02555-2. Immunol Lett. 1996. PMID: 8811345 Review.
Cited by
-
Predominant envelope variable loop 2-specific and gp120-specific antibody-dependent cellular cytotoxicity antibody responses in acutely SIV-infected African green monkeys.Retrovirology. 2018 Mar 9;15(1):24. doi: 10.1186/s12977-018-0406-5. Retrovirology. 2018. PMID: 29523166 Free PMC article.
-
Early induction of polyfunctional simian immunodeficiency virus (SIV)-specific T lymphocytes and rapid disappearance of SIV from lymph nodes of sooty mangabeys during primary infection.J Immunol. 2011 May 1;186(9):5151-61. doi: 10.4049/jimmunol.1004110. Epub 2011 Mar 25. J Immunol. 2011. PMID: 21441446 Free PMC article.
-
Where the wild things are: pathogenesis of SIV infection in African nonhuman primate hosts.Curr HIV/AIDS Rep. 2010 Feb;7(1):28-36. doi: 10.1007/s11904-009-0034-8. Curr HIV/AIDS Rep. 2010. PMID: 20425055 Free PMC article. Review.
-
Distinct evolutionary pressures underlie diversity in simian immunodeficiency virus and human immunodeficiency virus lineages.J Virol. 2012 Dec;86(24):13217-31. doi: 10.1128/JVI.01862-12. Epub 2012 Oct 10. J Virol. 2012. PMID: 23055550 Free PMC article.
-
SIV infection in natural hosts: resolution of immune activation during the acute-to-chronic transition phase.Microbes Infect. 2011 Jan;13(1):14-24. doi: 10.1016/j.micinf.2010.09.011. Epub 2010 Oct 15. Microbes Infect. 2011. PMID: 20951225 Free PMC article. Review.
References
-
- Allan, J. S., P. Kanda, R. C. Kennedy, E. K. Cobb, M. Anthony, and J. W. Eichberg. 1990. Isolation and characterization of simian immunodeficiency viruses from two subspecies of African green monkeys. AIDS Res. Hum. Retrovir. 6275-285. - PubMed
-
- Cumont, M. C., O. Diop, B. Vaslin, C. Elbim, L. Viollet, V. Monceaux, S. Lay, G. Silvestri, R. Le Grand, M. Muller-Trutwin, B. Hurtrel, and J. Estaquier. 2008. Early divergence in lymphoid tissue apoptosis between pathogenic and nonpathogenic simian immunodeficiency virus infections of nonhuman primates. J. Virol. 821175-1184. - PMC - PubMed
-
- Diop, O. M., A. Gueye, M. Dias-Tavares, C. Kornfeld, A. Faye, P. Ave, M. Huerre, S. Corbet, F. Barre-Sinoussi, and M. C. Muller-Trutwin. 2000. High levels of viral replication during primary simian immunodeficiency virus SIVagm infection are rapidly and strongly controlled in African green monkeys. J. Virol. 747538-7547. - PMC - PubMed
Publication types
MeSH terms
Substances
Grants and funding
LinkOut - more resources
Full Text Sources
Research Materials
