. 2009 Feb;20(4):1180-91.
doi: 10.1091/mbc.e08-08-0829. Epub 2008 Dec 24.

Autophagy provides nutrients but can lead to Chop-dependent induction of Bim to sensitize growth factor-deprived cells to apoptosis

Affiliations

Autophagy provides nutrients but can lead to Chop-dependent induction of Bim to sensitize growth factor-deprived cells to apoptosis

Brian J Altman et al. Mol Biol Cell. 2009 Feb.

Abstract

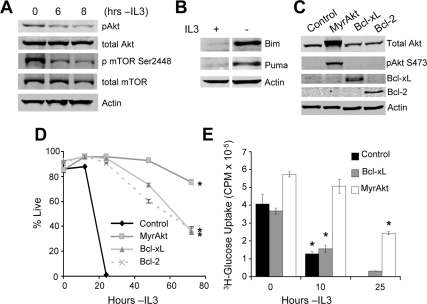
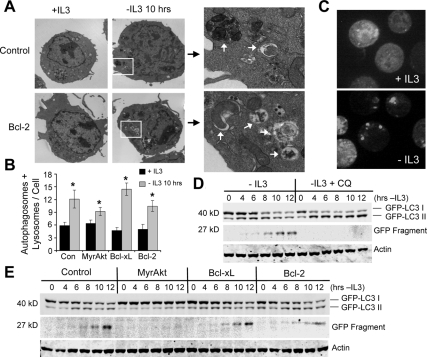
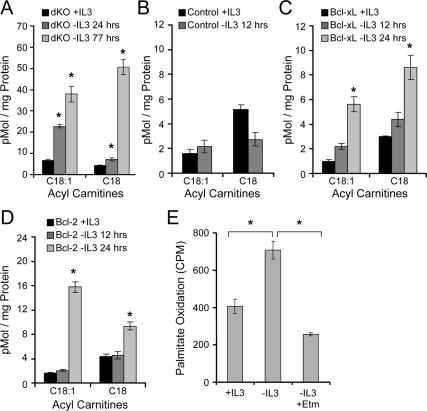
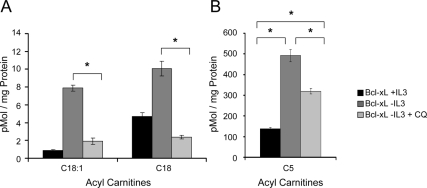
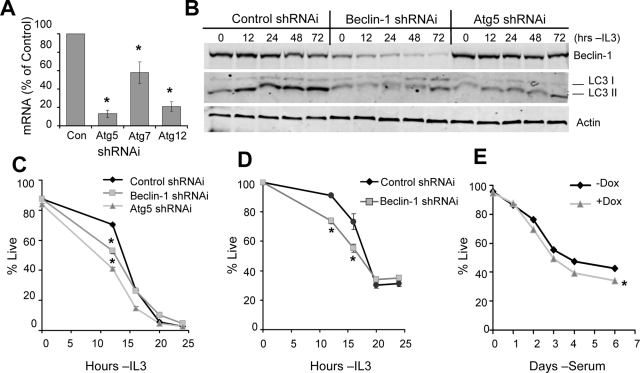
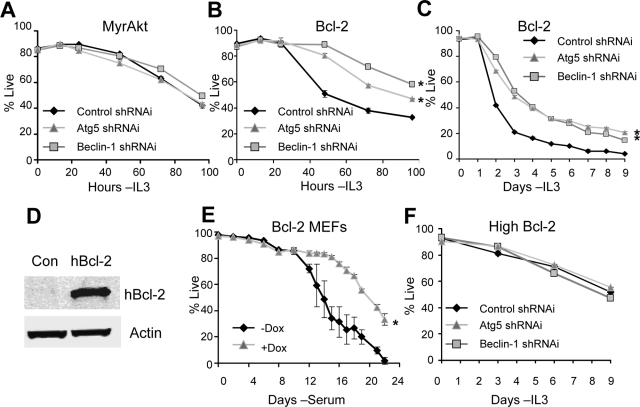
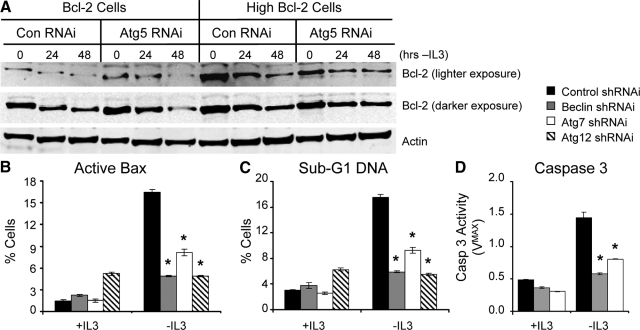
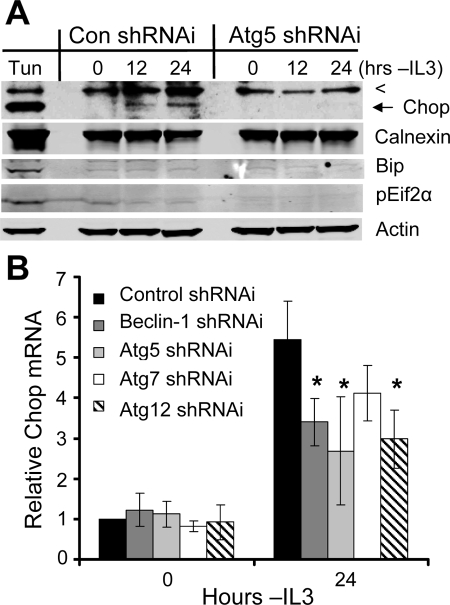
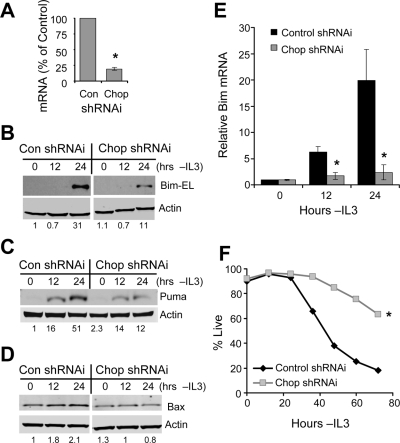
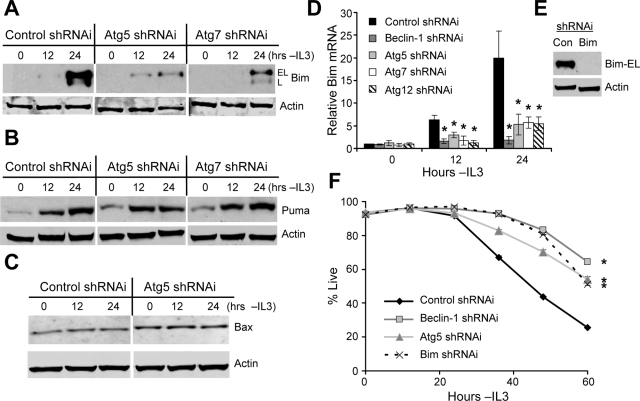
Tissue homeostasis is controlled by the availability of growth factors, which sustain exogenous nutrient uptake and prevent apoptosis. Although autophagy can provide an alternate intracellular nutrient source to support essential basal metabolism of apoptosis-resistant growth factor-withdrawn cells, antiapoptotic Bcl-2 family proteins can suppress autophagy in some settings. Thus, the role of autophagy and interactions between autophagy and apoptosis in growth factor-withdrawn cells expressing Bcl-2 or Bcl-xL were unclear. Here we show autophagy was rapidly induced in hematopoietic cells upon growth factor withdrawal regardless of Bcl-2 or Bcl-xL expression and led to increased mitochondrial lipid oxidation. Deficiency in autophagy-essential gene expression, however, did not lead to metabolic catastrophe and rapid death of growth factor-deprived cells. Rather, inhibition of autophagy enhanced survival of cells with moderate Bcl-2 expression for greater than 1 wk, indicating that autophagy promoted cell death in this time frame. Cell death was not autophagic, but apoptotic, and relied on Chop-dependent induction of the proapoptotic Bcl-2 family protein Bim. Therefore, although ultimately important, autophagy-derived nutrients appear initially nonessential after growth factor withdrawal. Instead, autophagy promotes tissue homeostasis by sensitizing cells to apoptosis to ensure only the most apoptosis-resistant cells survive long-term using autophagy-derived nutrients when growth factor deprived.


Figures

Figure 1.
Figure 1.
Bcl-2 and Bcl-xL prevent cell death in growth factor–deprived cells despite decreased glucose uptake. (A and B) Cells were cultured in IL3 or withdrawn from IL3 for (A) 6 or (B) 10 h and analyzed by immunoblot. (C) The expression of MyrAkt, Bcl-xL, and Bcl-2 was established by immunoblot. Cell survival (D) and glucose uptake (E) were determined at indicated times after IL3 withdrawal. Means of triplicate samples and SDs are shown for survival curves and SEs for glucose uptake. Data shown are representative of three or more experiments. *p < 0.05 by Student's t test of IL3 withdrawn samples compared with control (D) or + IL3 samples (E).
Figure 2.
Figure 2.
Bcl-xL and Bcl-2 expression do not prevent induction of autophagy after growth factor withdrawal. (A) Control and Bcl-2–expressing cells were cultured in IL3 or withdrawn from IL3 for 10 h and examined by transmission electron microscopy. Boxed areas are shown in detail on right, and white arrows indicate autophagosomes and autolysosomes. (B) Quantitation of autophagomes and lysosomes in control (Con) and MyrAkt-, Bcl-xL–, and Bcl-2–expressing cells cultured in IL3 or withdrawn from IL3 for 10 h (n = 27 cells each). Means and SEs are shown. *p < 0.05 by Student's t test of IL3 withdrawn samples compared with +IL3 samples. (C) Bcl-xL–expressing cells stably expressing GFP-LC3 were deprived of cytokine for 6 h and examined by fluorescence microscopy for localization of GFP-LC3. (D) Cells expressing GFP-LC3 were deprived of cytokine for indicated times in the absence or presence of chloroquine (CQ), and GFP-LC3 processing was assessed by anti-GFP immunoblot. (E) Control and Myr-Akt–, Bcl-xL–, and Bcl-2–expressing cells with stable GFP-LC3 expression were withdrawn from IL3 for indicated times, and GFP-LC3 processing was observed by immunoblot. Data shown are representative of three or more experiments.
Figure 3.
Figure 3.
Growth factor withdrawal promotes production and metabolism of long-chain fatty acids. (A–D) IL3-dependent Bax−/− Bak−/− (dKO; A), Control (B), Bcl-xL (C), and Bcl-2 (D) cells were cultured in IL3 or withdrawn from IL3 for indicated times, and C18:1 (oleate) and C18 (stearate) levels were measured by tandem mass spectrometry for acyl-carnitines. (E) Bcl-xL–expressing cells were incubated with 3H-palmitate for 48 h, washed, and cultured in the presence of IL3 or withdrawn from IL3 for 1 d. Generation of tritiated water was measured as an indication of palmitate metabolism. Etomoxir (Etm), a β-oxidation inhibitor, was added to some samples. Means of triplicate samples and SEs are shown. *p < 0.05 by Student's t test of IL3 withdrawn samples compared with +IL3 samples, except where otherwise indicated. Data shown are representative of three or more experiments.
Figure 4.
Figure 4.
Autophagy serves as a sole source of lipid- but not amino acid–derived metabolites for mitochondrial oxidation after growth factor withdrawal. (A and B) Bcl-xL–expressing cells were cultured in IL3 or withdrawn from IL3 for 1 d. Chloroquine (CQ) was added to some samples 8 h before harvest to inhibit lysosomal degradation pathways. (A) Lipid-derived long-chain– and (B) amino acid–derived short-chain acyl-carnitines were measured by tandem mass spectrometry. Means of triplicate samples and SEs are shown. *p < 0.05 by Student's t test of IL3 withdrawn samples compared with +IL3 samples, except where otherwise indicated.
Figure 5.
Figure 5.
Autophagy supports cell survival in a nutrient-independent manner early after cytokine withdrawal. (A) Efficiency of mRNA suppression for shRNAi against Atg5, Atg7, or Atg12 was determined by quantitative real-time PCR. (B) Bcl-2 cells were transiently transfected with control, Beclin-1, or Atg5 shRNAi, withdrawn from cytokine for up to 48 h, and harvested, and Beclin-1 knockdown efficiency and endogenous LC3 processing were detected by immunoblot. (C and D) Control (C) and Glut1/Hexokinase-expressing (D) cells were transfected with control, Beclin-1, or Atg5 shRNAi, and viability was observed over time after IL3 withdrawal. (E) Atg5 Tet-Off MEFs were treated with PBS or 5 μg/ml doxycycline for 4 d, withdrawn from serum, and analyzed for viability. Means and SDs from triplicate samples are shown. *p < 0.05 by Student's t test of test samples relative to control samples. Data shown are representative of three or more experiments.
Figure 6.
Figure 6.
Autophagy induces cell death in growth factor–deprived Bcl-2– and Bcl-xL–expressing cells. (A and B) MyrAkt (A) and Bcl-2–expressing (B) cells were transfected with control, Beclin-1, or Atg5 shRNAi, and cell viability was observed over time after IL3 withdrawal. (C) Moderate Bcl-2–expressing cells transfected with control, Beclin-1, or Atg5 shRNAi were withdrawn from cytokine, and viability was tracked over 9 d. (D) Human Bcl-2 was overexpressed in Atg5 Tet-Off MEFs. Protein levels were analyzed by immunoblot. (E) Atg5 Tet-Off MEFs expressing Bcl-2 were treated with PBS or 5 μg/ml doxycycline for 4 d, withdrawn from serum, and analyzed for viability over the indicated time course. (F) Cells with high Bcl-2 expression were transfected with control, Beclin-1, or Atg5 shRNAi, and withdrawn from cytokine, and viability was tracked over 9 d. Means and SDs of triplicate samples are shown. *p < 0.05 by Student's t test of test samples relative to control samples. For death curves, *p < 0.05 by Student's t test for multiple time points for test samples relative to control samples. Data shown are representative of three or more experiments.
Figure 7.
Figure 7.
Autophagy does not lead to Bcl-2 degradation, but does promote apoptosis in growth factor deprived Bcl-2–expressing cells. (A) Moderate (left) and high (right) Bcl-2–expressing cells were transfected with control or Atg5 shRNAi, withdrawn from cytokine, and analyzed for exogenous human Bcl-2 protein expression. (B and C) Moderate Bcl-2–expressing cells were transfected with Control, Beclin, Atg7, or Atg12 and active Bax (B), and sub-G1 DNA content (C) was analyzed in the presence of IL3 or after 36-h IL3 withdrawal. (D) Caspase 3 activity was measured in Bcl-2–expressing cells transfected with control, Beclin-1, or Atg7 shRNAi in the presence of IL3 or after 24-h IL3 withdrawal. Means and SDs of triplicate samples are shown. *p < 0.05 by Student's t test of test samples relative to control samples. Data shown are representative of three or more experiments.
Figure 8.
Figure 8.
Autophagy promotes induction of the proapoptotic transcription factor Chop after growth factor withdrawal. (A) Bcl-2–expressing cells were treated with tunicamycin (Tun) for 12 h or transfected with control (Con) or Atg5 shRNAi and withdrawn from cytokine for the indicated times. Expression of Chop, Calnexin, Bip, and pEif2α was determined by immunoblot. The top line is a nonspecific band (<), and Chop is indicated by an arrow. (B) Bcl-2–expressing cells were transfected with control or shRNAi against autophagy-essential genes, and IL3 was withdrawn for 1 d, and then Chop mRNA levels were analyzed by quantitative real-time PCR. Means and SDs of triplicate independent experiments are shown. *p < 0.05 by Student's t test of test samples relative to control samples. Data shown are representative of three or more experiments.
Figure 9.
Figure 9.
Chop is required for induction of proapoptotic Bcl-2 family proteins and cell death upon growth factor withdrawal. (A–D) Bcl-2–expressing cells were transfected with control (Con) or Chop shRNAi and withdrawn from IL3 for the indicated times. (A) Inhibition of Chop expression by shRNAi was tested by quantitative real-time PCR. Induction of Bim-EL (B), Puma (C), and Bax (D) in control (Con) or Chop shRNAi transfected cells was observed by immunoblot. Bim mRNA (E) was harvested, and mRNA levels were determined by quantitative real-time PCR. (F) Bcl-2–expressing cells were transfected with control or Chop shRNAi, withdrawn from IL3, and cell survival was observed over time. Means and SDs of triplicate samples are shown. *p < 0.05 by Student's t test of test samples relative to control samples. For death curves, *p < 0.05 by Student's t test for multiple time points for test samples relative to control samples. Data shown are representative of three or more experiments. For immunoblots, levels of proteins under analysis were quantified by normalization to actin and to the control sample in each panel, and quantitations are shown under each lane.
Figure 10.
Figure 10.
Autophagy specifically up-regulates the proapoptotic protein Bim in a Chop-dependent manner. (A–C) Bcl-2–expressing cells were transiently transfected with control, Atg5 or Atg7 shRNAi, withdrawn from IL3 for the indicated times, and Bim-EL and Bim-L (A), Puma (B), and Bax (C) levels were determined by immunoblot. (D) Bcl-2–expressing cells were transfected with control, Beclin-1, Atg5, Atg7, or Atg12 shRNAi, and IL3 was withdrawn for indicated times. RNA was harvested, and Bim mRNA levels were analyzed by quantitative real-time PCR. (E and F) Bcl-2 cells were transfected with control (Con), Beclin-1, Atg5, or Bim shRNAi. (E) Inhibition of Bim expression by shRNAi was tested by immunoblot of IL3-deprived cells. (F) Cell viability was observed over time after IL3 withdrawal. Means and SDs from triplicate samples are shown. *p < 0.05 by Student's t test of test samples relative to control samples. For death curves, *p < 0.05 by Student's t test for multiple time points for test samples relative to control samples. Data shown are representative of three or more experiments.

Comment in

  • Mol Biol Cell. 20:1119.

References

    1. Abedin M. J., Wang D., McDonnell M. A., Lehmann U., Kelekar A. Autophagy delays apoptotic death in breast cancer cells following DNA damage. Cell Death Differ. 2007;14:500–510. - PubMed
    1. Akdemir F., et al. Autophagy occurs upstream or parallel to the apoptosome during histolytic cell death. Development. 2006;133:1457–1465. - PubMed
    1. An J., Muoio D. M., Shiota M., Fujimoto Y., Cline G. W., Shulman G. I., Koves T. R., Stevens R., Millington D., Newgard C. B. Hepatic expression of malonyl-CoA decarboxylase reverses muscle, liver and whole-animal insulin resistance. Nat. Med. 2004;10:268–274. - PubMed
    1. Bouillet P., Metcalf D., Huang D. C., Tarlinton D. M., Kay T. W., Kontgen F., Adams J. M., Strasser A. Proapoptotic Bcl-2 relative Bim required for certain apoptotic responses, leukocyte homeostasis, and to preclude autoimmunity. Science. 1999;286:1735–1738. - PubMed
    1. Colell A., et al. GAPDH and autophagy preserve survival after apoptotic cytochrome c release in the absence of caspase activation. Cell. 2007;129:983–997. - PubMed

Publication types