. 2009 Jan 6;106(1):197-202.
doi: 10.1073/pnas.0806649105. Epub 2008 Dec 24.

Trophic cascades promote threshold-like shifts in pelagic marine ecosystems

Affiliations

Trophic cascades promote threshold-like shifts in pelagic marine ecosystems

Michele Casini et al. Proc Natl Acad Sci U S A. .

Abstract

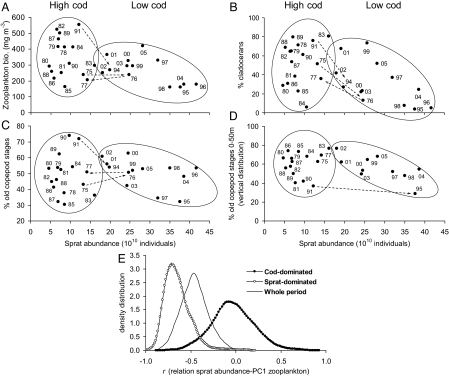
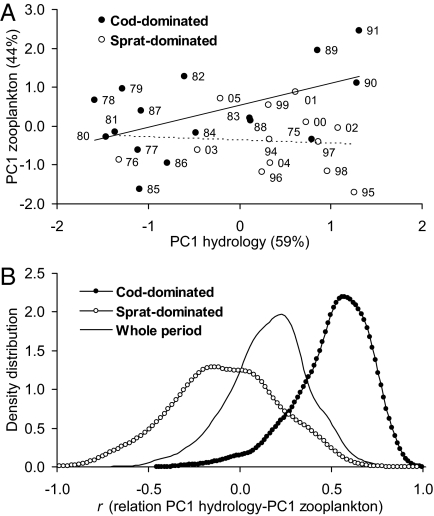
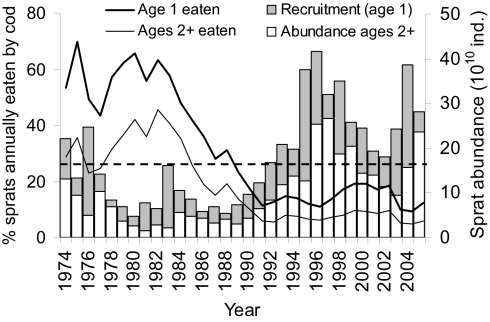
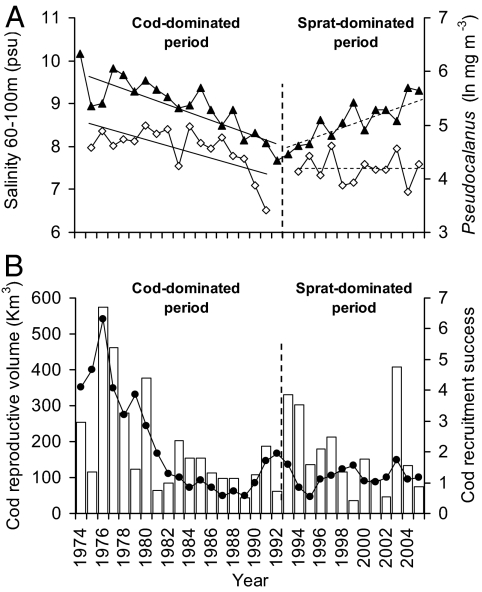
Fisheries can have a large impact on marine ecosystems, because the effects of removing large predatory fish may cascade down the food web. The implications of these cascading processes on system functioning and resilience remain a source of intense scientific debate. By using field data covering a 30-year period, we show for the Baltic Sea that the underlying mechanisms of trophic cascades produced a shift in ecosystem functioning after the collapse of the top predator cod. We identified an ecological threshold, corresponding to a planktivore abundance of approximately 17 x 10(10) individuals, that separates 2 ecosystem configurations in which zooplankton dynamics are driven by either hydroclimatic forces or predation pressure. Abundances of the planktivore sprat above the threshold decouple zooplankton dynamics from hydrological circumstances. The current strong regulation by sprat of the feeding resources for larval cod may hinder cod recovery and the return of the ecosystem to a prior state. This calls for the inclusion of a food web perspective in management decisions.


Conflict of interest statement

The authors declare no conflict of interest.

Figures

Fig. 1.
Fig. 1.
Alternative configurations of the central Baltic Sea ecosystem. The 2 configurations are illustrated as the relation between sprat abundance and (A) zooplankton biomass; (B) proportion (%) of cladocerans in the zooplankton community; (C) proportion (%) of large copepod stages in the copepod group; and (D) proportion (%) of large copepod stages occurring in the upper 50-m depth, proxy for vertical distribution. The 2 configurations correspond to the situations of high cod/low sprat (left ellipses) and of low cod/high sprat (right ellipses), respectively, and were separated by piecewise regression and TGAM. Numbers associated with each point indicate observation year. Ellipses were drawn by eyes to assemble the points belonging to either configuration. The dashed lines show the transit from one configuration to the other. See Table 1 for the statistics of the correlations between sprat abundance and zooplankton parameters, in the whole study period and in the 2 configurations. (E) Density distribution of the correlation coefficients between sprat abundance and PC1 of zooplankton parameters, which was obtained by bootstrap resampling (10,000 times) in the whole study period and in the 2 configurations. See Table S4 for statistical comparisons among the distributions.
Fig. 2.
Fig. 2.
Dual relationship between zooplankton and hydrological factors in the 2 alternative configurations. (A) Relationships between the PC1 of hydrological factors (temperature and salinity 0–100 m in spring and summer) and PC1 of zooplankton parameters in the 2 configurations. Cod-dominated: r = 0.53, P = 0.03; sprat-dominated: r = 0.074, P = 0.81. Factor loadings show association of zooplankton PC1 with total zooplankton biomass, whereas PC1 of hydrology is related mostly to salinity in summer. Numbers associated with each point indicate observation year. (B) Density distribution of the correlation coefficients between the PC1 of hydrological factors and PC1 of zooplankton parameters, obtained by bootstrap resampling (10,000 times) in the whole study period and in the 2 configurations. See Table S4 for statistical comparisons among the distributions. In bold are the significant correlations, at α = 0.05.
Fig. 3.
Fig. 3.
Trends in annual sprat predation mortality and sprat abundance in relation to the ecological threshold. The columns represent sprat total abundance divided into recruits (age 1) and older individuals (ages 2+). The lines show the trends in the proportion of sprats that are eaten annually by cod (proportion of age t sprats that die from age t to age t + 1 because of cod predation). The horizontal dashed line indicates the sprat abundance threshold that separates the 2 ecosystem configurations (see Fig. 1).
Fig. 4.
Fig. 4.
Potential ecological mechanisms hindering the success of cod recruitment. (A) Trends in salinity (▲) and Pseudocalanus spp. biomass (average spring-summer) (◇) in the central Baltic Sea. Pseudocalanus spp. is one of the main prey for sprat and larval/postlarval cod (30). Salinity between 60 and 100 m of depth was considered here because this plankter occurs mainly in deeper water layers, where it encounters favorable salinity conditions for reproduction (30). Salinity and Pseudocalanus spp. are positively correlated in the cod-dominated period (r = 0.67, P < 0.01), whereas in the sprat-dominated period the correlation disappears (r = −0.51, P = 0.09). Overall relation: r = 0.44, P = 0.02 (r* = 0.17, P* = 0.36). (B) Trends in cod reproductive volume (columns) and cod recruitment success (●). Relation between cod recruitment volume and recruitment success in the cod-dominated period (r = 0.71, P < 0.001) and in the sprat-dominated period (r = 0.27, P = 0.34). Overall relation: r = 0.59, P = 0.001. The vertical dashed lines indicate the time when sprat rose above the abundance threshold without any further reversal (see also Fig. 3). In bold are the significant correlations, at α = 0.05.

References

    1. Ecology. Special feature: Top-down and bottom-up forces. Ecology. 1992;73:723–765.
    1. Menge BA, et al. Benthic-pelagic links and rocky intertidal communities: bottom-up effects on top-down control? Proc Natl Acad Sci USA. 1997;94:14530–14535. - PMC - PubMed
    1. Winder M, Schindler DE. Climate change uncouples trophic interactions in an aquatic ecosystem. Ecology. 2004;85:2100–2106.
    1. Vinueza LR, Branch GM, Branch ML, Bustamante RH. Top-down herbivory and bottom-up El Niño effects on Galápagos rocky-shore communities. Ecol Monog. 2006;76:111–131.
    1. Brander KM. Global fish production and climate change. Proc Natl Acad Sci USA. 2007;104:19709–19714. - PMC - PubMed

Publication types