. 2009 Jan 6;106(1):28-32.
doi: 10.1073/pnas.0806887106. Epub 2008 Dec 24.

Nonlinear threshold behavior during the loss of Arctic sea ice

Affiliations

Nonlinear threshold behavior during the loss of Arctic sea ice

I Eisenman et al. Proc Natl Acad Sci U S A. .

Abstract

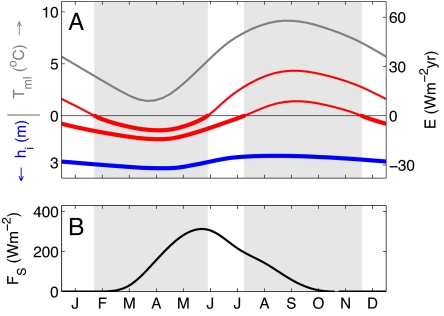
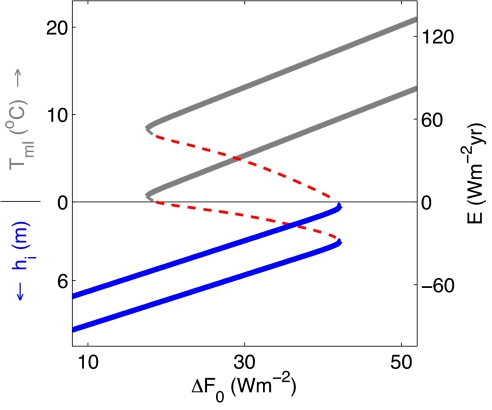
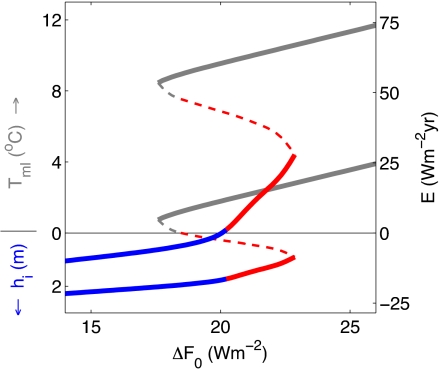
In light of the rapid recent retreat of Arctic sea ice, a number of studies have discussed the possibility of a critical threshold (or "tipping point") beyond which the ice-albedo feedback causes the ice cover to melt away in an irreversible process. The focus has typically been centered on the annual minimum (September) ice cover, which is often seen as particularly susceptible to destabilization by the ice-albedo feedback. Here, we examine the central physical processes associated with the transition from ice-covered to ice-free Arctic Ocean conditions. We show that although the ice-albedo feedback promotes the existence of multiple ice-cover states, the stabilizing thermodynamic effects of sea ice mitigate this when the Arctic Ocean is ice covered during a sufficiently large fraction of the year. These results suggest that critical threshold behavior is unlikely during the approach from current perennial sea-ice conditions to seasonally ice-free conditions. In a further warmed climate, however, we find that a critical threshold associated with the sudden loss of the remaining wintertime-only sea ice cover may be likely.


Conflict of interest statement

The authors declare no conflict of interest.

Figures

Fig. 1.
Fig. 1.
Sea ice seasonal cycle in a warming climate and solar radiation. (A) Seasonal cycle of stable solutions of the full nonlinear model are illustrated by plotting the model state E (energy per unit area in ocean mixed layer sensible heat or sea ice latent heat) versus time of year. Four solutions are plotted, each with different levels of surface heating ΔF0: a perennial ice state (blue curve, ΔF0 = 0), seasonally ice-free states with most of the year ice covered (lower red curve, ΔF0 = 21 Wm−2) or most of the year ice free (upper red curve, ΔF0 = 23 Wm−2), and a perennially ice-free state (gray curve, ΔF0 = 19 Wm−2). As described in Eq. 1, when E > 0, it represents the mixed-layer temperature of an ice-free ocean (E = cmlHmlTml). At E = 0, the ocean mixed layer reaches the freezing point (Tml = 0 °C), and further cooling will cause ice to grow. When E < 0, it represents the sea-ice thickness (E = −Li hi); note that ice thickness increases downward. Model solutions are drawn with thicker lines when the ocean is ice covered and thinner lines when the ocean is ice free. Solutions are obtained by integrating Eqs. 24 with seasonally varying parameter values given in Table S1 in SI Appendix until the model has converged on a steady-state seasonal cycle. The light-gray shaded region to the right represents the first months to become ice free in a warming climate (demarcated by zero-crossings of the seasonally ice-free solution with ΔF0 = 21 Wm−2), whereas the light-gray shaded region to the left represents the last months that are ice covered in a further warmed climate (demarcated by zero-crossings of the seasonally ice-free solution with ΔF0 = 23 Wm−2). (B) Seasonal cycle of incident solar radiation specified in the model based on central Arctic surface observations (13), indicating that the first months to become ice free in a warming climate (light-gray region to right) and the last months to be ice covered in a further warmed climate (light-gray region to left) experience similar amounts of solar radiation. Note that the radiation curve is asymmetric because of seasonal differences in Arctic cloudiness, but the qualitative results presented here do not depend on this asymmetry.
Fig. 2.
Fig. 2.
Bifurcation diagram for the partially linearized model, where nonlinear sea-ice thermodynamic effects have been excluded but the ice–albedo feedback has been retained (Eqs. 2, 4, and 5). For each value of the surface heating ΔF0, the model is integrated until it converges on a steady-state seasonal cycle, and the annual maximum (upper curve) and annual minimum (lower curve) values of E are plotted. Solutions with perennial sea-ice cover are indicated in blue, seasonally ice-free solutions in red, and perennially ice-free solutions in gray. Dashed lines indicate unstable solutions, which have been determined by constructing an annual Poincaré map and finding the fixed points (i.e., numerically integrating the model for 1 year starting from an array of initial conditions and identifying the solutions with the same value of E at the end of the year as the initial condition). The curves have been smoothed with a boxcar filter to suppress a small level of noise associated with numerical integration. Note that the lines are slightly curved at the 2 bifurcation points because of the smooth albedo transition associated with hα > 0. The vertical axis is labeled as in Fig. 1A.
Fig. 3.
Fig. 3.
Bifurcation diagram for the full nonlinear model (Eqs. 24). Axes and colors are as described in the Fig. 2 legend. The inclusion of nonlinear sea-ice thermodynamic effects stabilizes the model when sea ice is present during a sufficiently large fraction of the year, allowing stable seasonally ice-free solutions (red solid curves). Under a moderate warming (ΔF0 = 15 Wm−2), modeled sea-ice thickness varies seasonally between 0.9 and 2.2 m. Further warming (ΔF0 = 20 Wm−2) causes the September ice cover to disappear, and the system undergoes a smooth transition to seasonally ice-free conditions. When the model is further warmed (ΔF0 = 23 Wm−2), a saddle-node bifurcation occurs, and the wintertime sea ice cover abruptly disappears in an irreversible process. Although the specific values of ΔF0 at which the transitions occur are sensitive to parameter choices, the qualitative features of Fig. 3 are highly robust to changes in model parameter values (Fig. S4 in SI Appendix).

References

    1. Stroeve JC, et al. Tracking the Arctic's shrinking ice cover: Another extreme September minimum in 2004. Geophys Res Lett. 2005;32:L04501.
    1. Perovich DK, et al. Increasing solar heating of the Arctic Ocean and adjacent seas, 1979–2005: Attribution and role in the ice–albedo feedback. Geophys Res Lett. 2007;34:L19505.
    1. Lindsay RW, Zhang J. The thinning of Arctic sea ice, 1988–2003: Have we passed a tipping point? J Clim. 2005;18:4879–4894.
    1. Overpeck J, et al. Arctic system on trajectory to new, seasonally ice-free state. EOS. 2005;86:309–313.
    1. Serreze MC, Francis JA. The Arctic amplification debate. Clim Change. 2006;76:241–264.

Publication types

LinkOut - more resources