

Near optimal combination of sensory and motor uncertainty in time during a naturalistic perception-action task
- PMID: 19109455
- PMCID: PMC2695629
- DOI: 10.1152/jn.90974.2008
Near optimal combination of sensory and motor uncertainty in time during a naturalistic perception-action task
Abstract
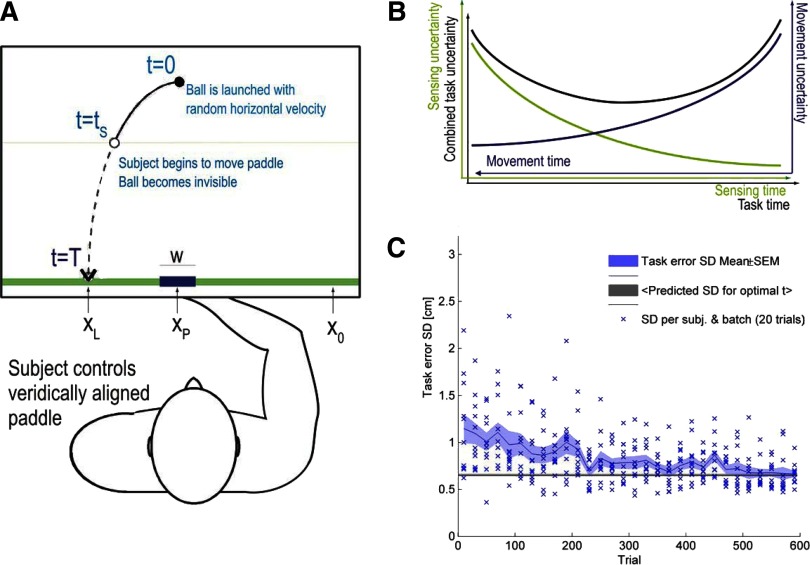
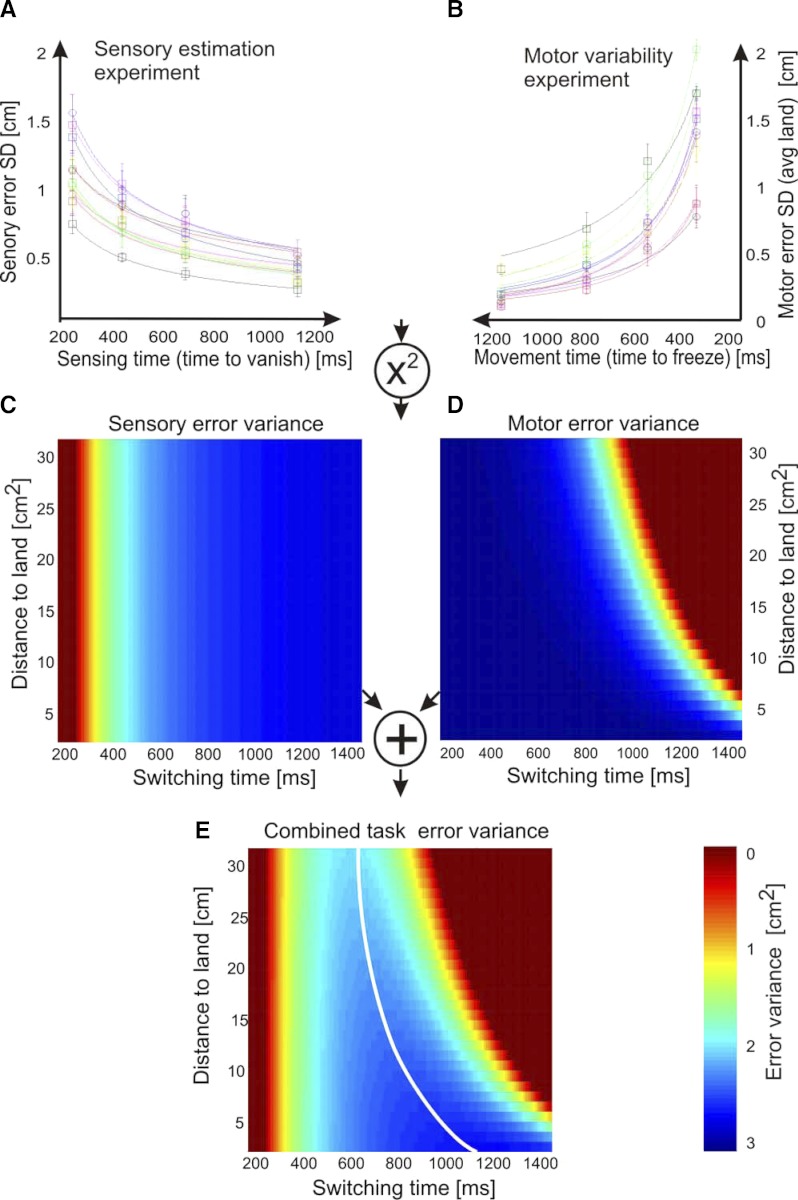
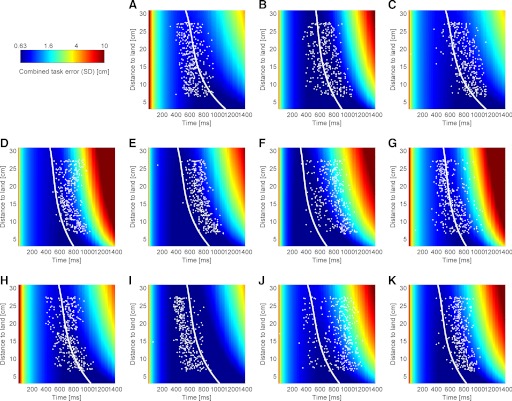
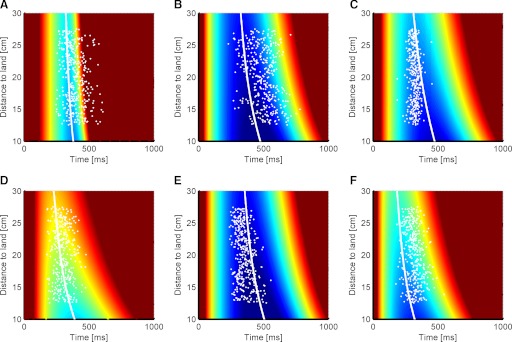
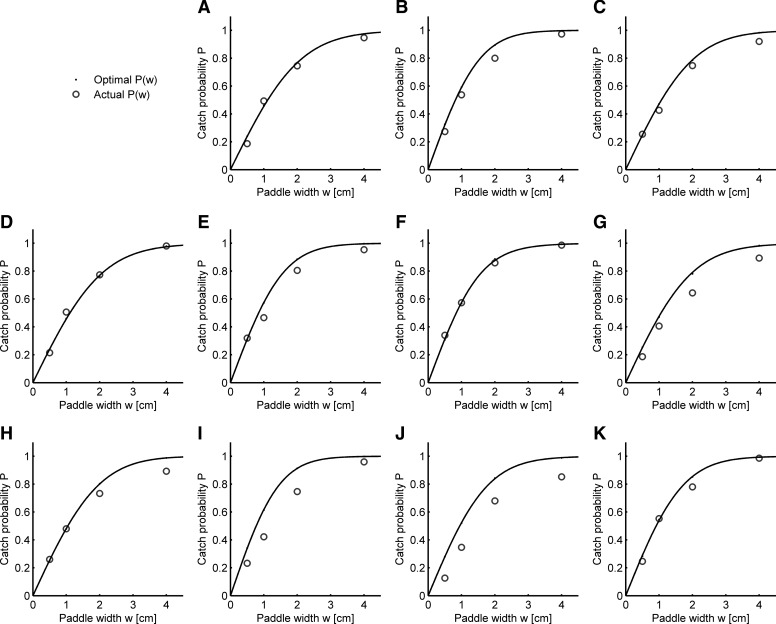
Most behavioral tasks have time constraints for successful completion, such as catching a ball in flight. Many of these tasks require trading off the time allocated to perception and action, especially when only one of the two is possible at any time. In general, the longer we perceive, the smaller the uncertainty in perceptual estimates. However, a longer perception phase leaves less time for action, which results in less precise movements. Here we examine subjects catching a virtual ball. Critically, as soon as subjects began to move, the ball became invisible. We study how subjects trade-off sensory and movement uncertainty by deciding when to initiate their actions. We formulate this task in a probabilistic framework and show that subjects' decisions when to start moving are statistically near optimal given their individual sensory and motor uncertainties. Moreover, we accurately predict individual subject's task performance. Thus we show that subjects in a natural task are quantitatively aware of how sensory and motor variability depend on time and act so as to minimize overall task variability.
Figures
Similar articles
-
Humans trade off viewing time and movement duration to improve visuomotor accuracy in a fast reaching task.J Neurosci. 2007 Jun 27;27(26):6984-94. doi: 10.1523/JNEUROSCI.1309-07.2007. J Neurosci. 2007. PMID: 17596447 Free PMC article.
-
Catching a gently thrown ball.Exp Brain Res. 2010 Oct;206(4):409-17. doi: 10.1007/s00221-010-2421-1. Epub 2010 Sep 23. Exp Brain Res. 2010. PMID: 20862460
-
The accuracy of interceptive action in time and space.Exerc Sport Sci Rev. 2004 Oct;32(4):167-73. doi: 10.1097/00003677-200410000-00008. Exerc Sport Sci Rev. 2004. PMID: 15604936
-
Probabilistic mechanisms in sensorimotor control.Novartis Found Symp. 2006;270:191-8; discussion 198-202, 232-7. Novartis Found Symp. 2006. PMID: 16649715 Review.
-
Depth perception by the active observer.Trends Cogn Sci. 2005 Sep;9(9):431-8. doi: 10.1016/j.tics.2005.06.018. Trends Cogn Sci. 2005. PMID: 16099197 Review.
Cited by
-
Knowing how much you don't know: a neural organization of uncertainty estimates.Nat Rev Neurosci. 2012 Jul 11;13(8):572-86. doi: 10.1038/nrn3289. Nat Rev Neurosci. 2012. PMID: 22781958 Review.
-
Precise timing when hitting falling balls.Front Hum Neurosci. 2014 May 22;8:342. doi: 10.3389/fnhum.2014.00342. eCollection 2014. Front Hum Neurosci. 2014. PMID: 24904380 Free PMC article.
-
Contrasting contributions of movement onset and duration to self-evaluation of sensorimotor timing performance.Eur J Neurosci. 2021 Aug;54(3):5092-5111. doi: 10.1111/ejn.15378. Epub 2021 Jul 13. Eur J Neurosci. 2021. PMID: 34196067 Free PMC article.
-
Adrenergic Modulation of Cortical Gain and Sensory Processing in the Mouse Visual Cortex.Brain Sci. 2025 Apr 17;15(4):406. doi: 10.3390/brainsci15040406. Brain Sci. 2025. PMID: 40309887 Free PMC article.
-
Spatiotemporal movement planning and rapid adaptation for manual interaction.PLoS One. 2013 May 28;8(5):e64982. doi: 10.1371/journal.pone.0064982. Print 2013. PLoS One. 2013. PMID: 23724112 Free PMC article.
References
-
- Alais D, Burr D. The ventriloquist effect results from near-optimal bimodal integration. Curr Biol 14: 257–262, 2004 - PubMed
-
- Beers RJ, Sittig AC, Denier JJ. How humans combine simultaneous proprioceptive and visual position information. Exp Brain Res 111: 253–261, 1996 - PubMed
-
- Brouwer AM, Brenner E, Smeets JB. Perception of acceleration with short presentation times: can acceleration be used in interception? Percept Psychophys 64: 1160–1168, 2002 - PubMed
-
- Brouwer AM, Lopez-Moliner J, Brenner E, Smeets JB. Determining whether a ball will land behind or in front of you: not just a combination of expansion and angular velocity. Vision Res 46: 382–391, 2006 - PubMed
Publication types
MeSH terms
Grants and funding
LinkOut - more resources
Full Text Sources