. 2008 Dec 24;28(52):14062-73.
doi: 10.1523/JNEUROSCI.3795-08.2008.

Nociceptors are interleukin-1beta sensors

Affiliations

Nociceptors are interleukin-1beta sensors

Alexander M Binshtok et al. J Neurosci. .

Abstract

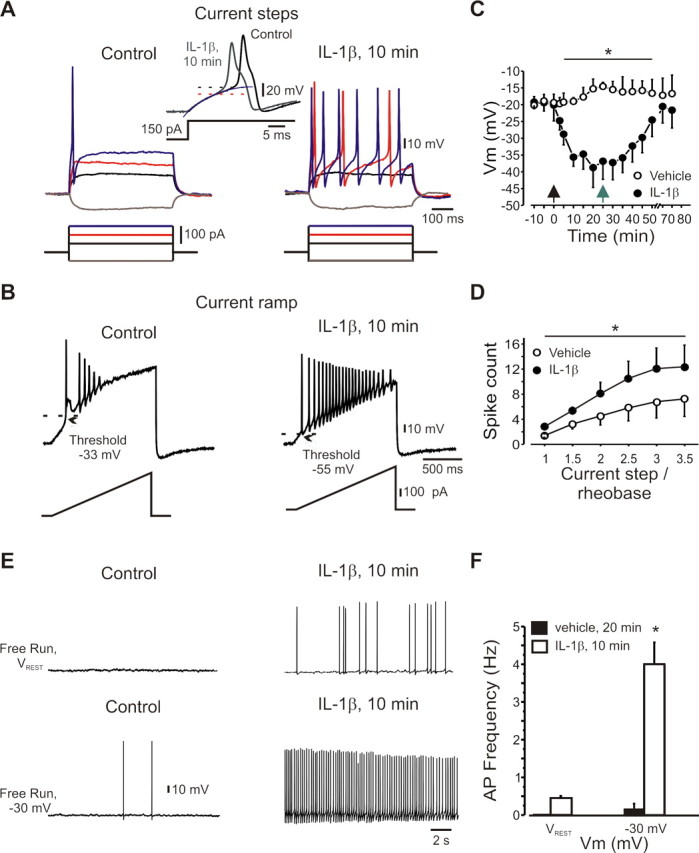
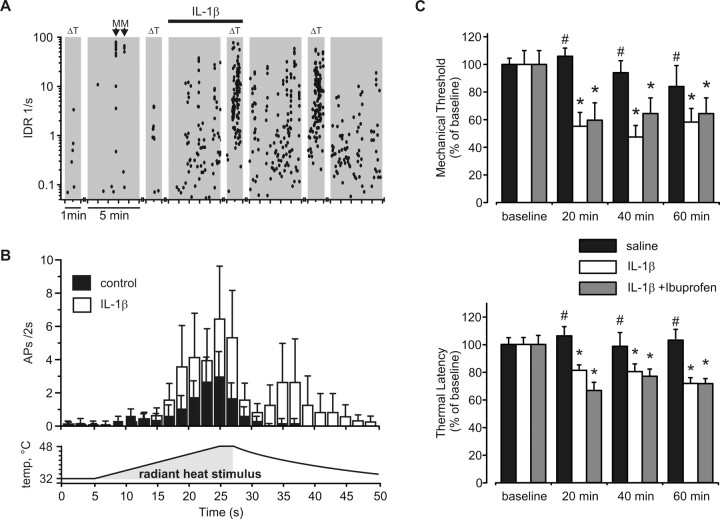
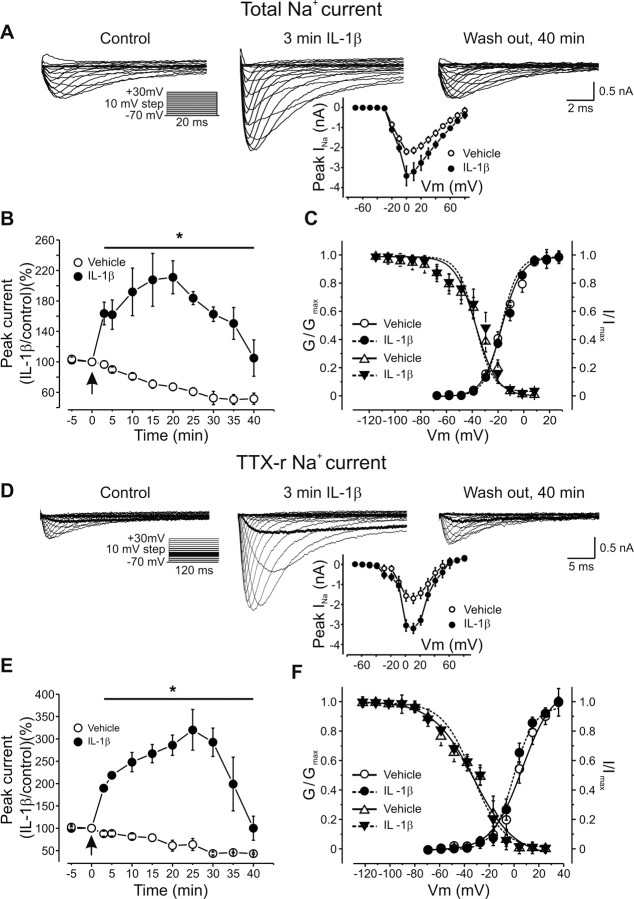
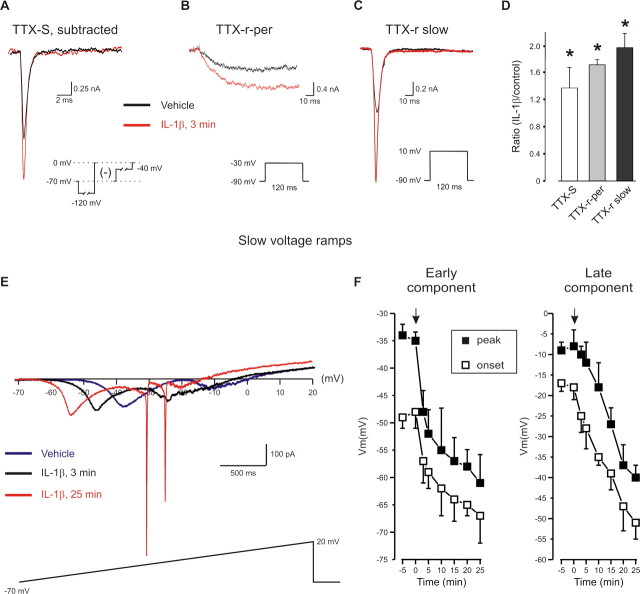
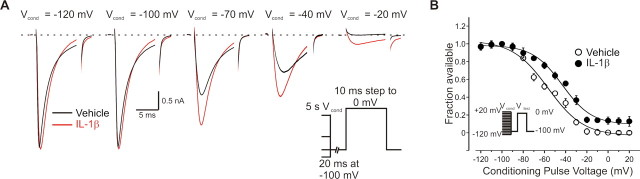
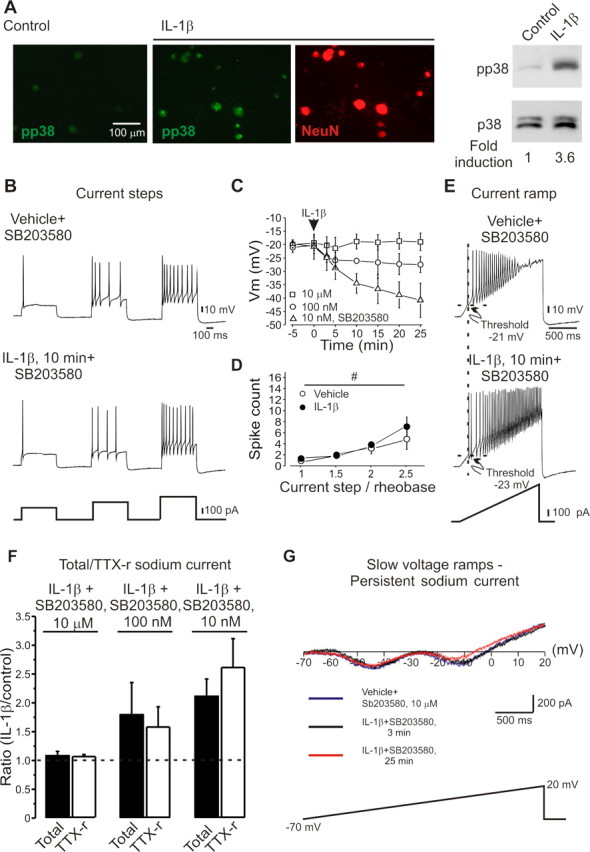
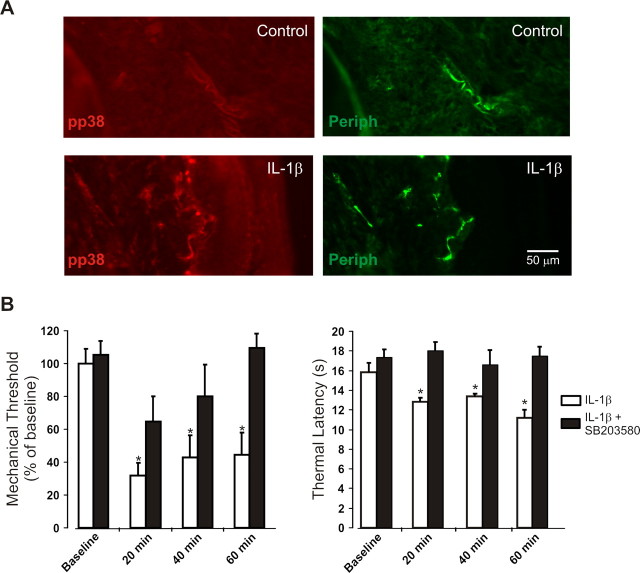
A cardinal feature of inflammation is heightened pain sensitivity at the site of the inflamed tissue. This results from the local release by immune and injured cells of nociceptor sensitizers, including prostaglandin E(2), bradykinin, and nerve growth factor, that reduce the threshold and increase the excitability of the peripheral terminals of nociceptors so that they now respond to innocuous stimuli: the phenomenon of peripheral sensitization. We show here that the proinflammatory cytokine interleukin-1beta (IL-1beta), in addition to producing inflammation and inducing synthesis of several nociceptor sensitizers, also rapidly and directly activates nociceptors to generate action potentials and induce pain hypersensitivity. IL-1beta acts in a p38 mitogen-activated protein kinase (p38 MAP kinase)-dependent manner, to increase the excitability of nociceptors by relieving resting slow inactivation of tetrodotoxin-resistant voltage-gated sodium channels and also enhances persistent TTX-resistant current near threshold. By acting as an IL-1beta sensor, nociceptors can directly signal the presence of ongoing tissue inflammation.


Figures

Figure 1.
Figure 1.
IL-1β increases the excitability of DRG neurons. A, Current-clamp recordings of nociceptor-like DRG neurons before and after IL-1β (10 ng/ml, 10 min). Inset, Expanded traces, Note the broadness of the action potential and the inflection on its falling phase. The dotted lines indicate the action potential threshold obtained as the point of deviation from single exponential fit (blue line) of subthreshold responses. B, IL-1β reduced threshold and decreased spike adaptation during a 1.5 s depolarizing ramp (333 pA/s). C, Time course of IL-1β effects on action potential threshold (n = 25). Time point “-10” refers to data collected shortly (<1 min) after membrane breakthrough; time point “-5” refers to data collected 5 min before the application of IL-1β or vehicle. Black arrow indicates time of application of IL-1β or vehicle, gray arrow indicates start of washout (n = 5 for washout). D, IL-1β (10 min) increased the number of spikes (mean ± SEM) evoked by suprathreshold stimuli. x-axis indicates the current step level normalized to rheobase for each cell tested (n = 25). E, F, Action potential firing elicited by IL-1β at resting membrane potential (V rest, typically −65 to −70 mV) and −30 mV (means ± SEM). Recordings made using extracellular solution 4 (Table 1).
Figure 2.
Figure 2.
IL-1β directly activates and sensitizes nociceptors. A, Instantaneous discharge rates (IDR) (each dot represents one action potential) of a saphenous nerve C-fiber (0.39 m/s, 1 mN) recorded in a skin/nerve preparation and its response to radiant heat stimulation (ΔT, narrow gray bars; 32−48°C, 22 s) (see Materials and Methods for description of ramp) applied in 5 min intervals (broad gray bars) before and after IL-1β (20 ng/ml). Arrows represent mechanical stimulation of receptive field. B, IL-1β-sensitized heat responses in CMH and AMH fibers (n = 6 CMH and n = 1 AMC) from 14.3 ± 0.1 to 39.4 ± 15.2 (50 s). (Bins 2 s, subject to two-point averaging.) C, Intraplantar IL-1β (1 pg/10 μl) and combination of IL-1β (1 pg/10 μl) with ibuprofen (100 mg/10 μl) induced mechanical (von Frey threshold) and thermal sensitivity (hot plate latency) in vivo. Mean ± SEM; *p < 0.05.
Figure 3.
Figure 3.
IL-1β increases sodium currents in DRG neurons. A, Increase in total sodium current produced by IL-1β (10 ng/ml). Inset, Averaged I–V curves obtained before and 3 min after application of IL-1β (n = 50). B, Time course of IL-1β mediated increase in total sodium current (n = 15, last 2 points n = 3, mean ± SEM). Note gradual decrease of sodium current amplitude when recorded without IL-1β (n = 10, last 3 points n = 3). Arrow indicates time of application of IL-1β or vehicle. Time point “-5” refers to data collected shortly after membrane breakthrough before the application. Peak current normalized to peak current density detected at “0” time point (173 ± 12 pA/pF, n = 50). C, G/G max (activation) and I/I max (availability) curves for total sodium curves reveal no shift in activation and inactivation of the current by IL-1β (p = 0.35, n = 10). D, IL-1β increased the TTX-r sodium current (300 nm TTX) (dark traces indicate TTX-r-per at −30 mV). Inset, Averaged I–V curves (n = 28) obtained before and 3 min after IL-1β application. E, Time course of the effect of IL-1β (mean ± SEM, n = 28 for IL-1β, n = 10 for controls, last 3 points n = 3). Arrow indicates time of application of IL-1β or vehicle. Time point “-5” refers to data collected shortly after membrane breakthrough before the application. Peak current normalized to peak current density detected at “0” time point (135.1 ± 12.1 pA/pF, n = 28). F, G/G max and I/I max curves of TTX-r sodium current shows no change in activation and fast steadystate inactivation (p = 0.5, n = 10). Recordings for A, B, D, and E were made using extracellular solution 1 and those for C and F using extracellular solution 2 (Table 1).
Figure 4.
Figure 4.
IL-1β increases the TTX-S and the slow and persistent components of the TTX-r sodium current. A, Representative traces of TTX-S before and after IL-1β following a depolarizing step to 0 mV. TTX-S current was assessed by subtraction of the current evoked by a 10 mV depolarization step after a 500 ms step to either −120 mV (for total sodium current) or −40 mV (for TTX-r current). B, C, In cells preincubated with 300 nm TTX, steps to −30 mV evoked TTX-r-per, whereas steps to +10 mV evoked TTX-r slow. D, IL-1β increased the density of TTX-S as well as TTX-r-per and TTX-r slow currents (n = 6 for TTX-S; n = 10 for TTX-R). E, Current–voltage curve during a slow depolarizing ramp (35 mV/s, −70 to +20 mV). Note “W” shaped inward current with clear early and late components. IL-1β increased the amplitude of early and late components of the inward current and shifted their activation and peak to more negative potentials. Fast inward currents after the slow ramp after prolonged (25 min) exposure IL-1β appeared in all recorded cells (n = 15) and reflect lost of voltage-clamp control possibly due to increase in membrane excitability. F, Arrow indicates time of application of IL-1β or vehicle. Time point of “-5” refers to data collected before the application. Recordings for A–D were made using extracellular solution 1, and those for E and F using extracellular solution 3 (Table 1).
Figure 5.
Figure 5.
IL-1β increases TTX-r sodium current due to a modulation of the voltage dependence of TTX-r sodium channel slow inactivation. A, Superimposed representative traces of TTX-r sodium currents before (black) and 3 min after (red) application of IL-1β. Currents were elicited by 10 ms test step to 0 mV after 5 s conditioning pulses (V cond) to indicated voltages. A 20 ms step to −100 mV was applied after conditioning pulses to remove fast inactivation. Note that prominent reduction of TTX-r current amplitude after prepulses to −70, −40, and −20 mV was attenuated by application of IL-1β (3 min). Traces (150 μs) were blanked to remove uncompensated capacitance transient currents. B, Voltage dependence of TTX-r sodium channels slow inactivation expressed as I test/I max plotted as a function of V cond before (open circles) and 5 min after (filled circles) IL-1β. Note significant (13.4 mV, p < 0.05, n = 10) rightward shift of midpoint voltage dependence of slow inactivation after application of IL-1β, together with reduction of maximal slow inactivation at depolarized voltages. Inset, Stimulus protocol. V cond was held constant at 5 s and its amplitude was varied between −120 and +20 mV. 20 ms step to −100 mV was applied before V test · I test was evoked by stepping to 0 mV. Membrane was held at −100 mV. Recordings made using extracellular solution 1 (Table 1).
Figure 6.
Figure 6.
IL-1β modulates activity of DRG neurons via p38 MAPK. A, Increase in phosphorylated p38 MAP kinase (pp38) in cultured DRG neurons after IL-1β (1 ng/ml, 10 min) demonstrated by immunocytochemistry and Western blot. B–E, Preincubation of DRG neurons for 40 min with the p38 inhibitor SB203580 (10 μm) prevented the IL-1β mediated increases in excitability. C, Dose dependent effect of SB203580 on IL-1β-mediated decrease of spike threshold. (□, 10 μm; ○, 100 nm; ▵, 10 nm). Arrow indicates time of application of IL-1β. Time point “-5” refers to data collected before application. Note no change in spike threshold after preincubation with 10 μm SB203580 and significant decrease of threshold after preincubation with 10 nm SB203580. D, SB203580 (10 μm) prevents IL-1β -mediated changes in numbers of spikes per stimulus (mean ± SEM) expressed as multiples of the rheobase for each recorded cell (n = 10). E, Ramp (333 pA/s) activated trains of action potentials showed no change in threshold after IL-1β in presence of SB203580 (10 μm), but still demonstrated reduced spike adaptation. F, The ratio of the mean peak total and TTX-r sodium current amplitude (IL-1β, 20 min/control) (n = 10) showed no change after IL-1β in cells preincubated with 10 μm SB203580 but increased significantly in presence of 10 nm SB203580. G, Quasi-steady-state current– voltage curves during a slow (35 mV/s) ramp demonstrating that SB203580 (10 μm) blocked the IL-1β -mediated change in both early (amplitudeVehicle 148 ± 34 pA vs 151 ± 42 pA, p = 0.23; current activation onsetVehicle −53 ± 8 mV vs −36 ± 9 mV, p = 0.21; and peakVehicle −42 ± 8 mV vs −45 ± 10 mV, p = 0.11, n = 10) and late components (amplitudeVehicle 112 ± 25 pA vs 105 ± 12 pA, p = 0.1; current activation onsetVehicle −23 ± 6 mV vs −24 ± 4 mV, p = 0.09 and peakVehicle −12 ± 5 mV vs −16 ± 5 mV, p = 0.26, n = 10) of resulting inward current. Recordings for B–E were made using extracellular solution 4, those for F, solution 1, and those for G, solution 3 (Table 1).
Figure 7.
Figure 7.
Activation of p38 MAPK contributes to the IL-1β-mediated behavioral decrease in mechanical threshold and thermal responsiveness. A, Phosphorylation of p38 in peripherin-positive cutaneous sensory fibers after intraplantar IL-1β injection (1 ng). B, Pretreatment with the p38 inhibitor SB203580 (50 μg) attenuated the effects of IL-1β on mechanical threshold and noxious heat response latency (mean ± SEM); *p < 0.05.

Similar articles

Cited by

References

    1. Abdulla FA, Smith PA. Axotomy- and autotomy-induced changes in the excitability of rat dorsal root ganglion neurons. J Neurophysiol. 2001;85:630–643. - PubMed
    1. Akopian AN, Sivilotti L, Wood JN. A tetrodotoxin-resistant voltage-gated sodium channel expressed by sensory neurons. Nature. 1996;379:257–262. - PubMed
    1. Amaya F, Wang H, Costigan M, Allchorne AJ, Hatcher JP, Egerton J, Stean T, Morisset V, Grose D, Gunthorpe MJ, Chessell IP, Tate S, Green PJ, Woolf CJ. The voltage-gated sodium channel Na(v) 1.9 is an effector of peripheral inflammatory pain hypersensitivity. J Neurosci. 2006;26:12852–12860. - PMC - PubMed
    1. Baker MD. Protein kinase C mediates up-regulation of tetrodotoxin-resistant, persistent Na+ current in rat and mouse sensory neurones. J Physiol. 2005;567:851–867. - PMC - PubMed
    1. Baker MD, Chandra SY, Ding Y, Waxman SG, Wood JN. GTP-induced tetrodotoxin-resistant Na+ current regulates excitability in mouse and rat small diameter sensory neurones. J Physiol. 2003;548:373–382. - PMC - PubMed

Publication types

MeSH terms

LinkOut - more resources