

The cortical signature of prodromal AD: regional thinning predicts mild AD dementia
- PMID: 19109536
- PMCID: PMC2677470
- DOI: 10.1212/01.wnl.0000340981.97664.2f
The cortical signature of prodromal AD: regional thinning predicts mild AD dementia
Abstract
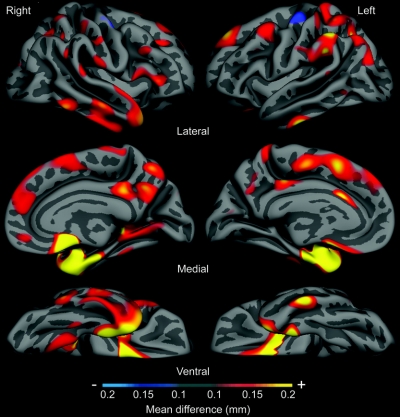
Objective: We previously used exploratory analyses across the entire cortex to determine that mild Alzheimer disease (AD) is reliably associated with a cortical signature of thinning in specific limbic and association regions. Here we investigated whether the cortical signature of AD-related thinning is present in individuals with questionable AD dementia (QAD) and whether a greater degree of regional cortical thinning predicts mild AD dementia.
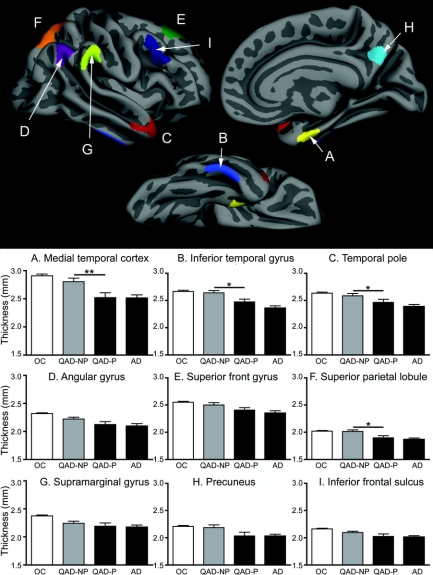
Methods: Participants included 49 older adults with mild impairment consistent with mild cognitive impairment (Clinical Dementia Rating [CDR] = 0.5) at the time of structural MRI scanning. Cortical thickness was measured in nine regions of interest (ROIs) identified previously from a comparison of patients with mild AD and controls.
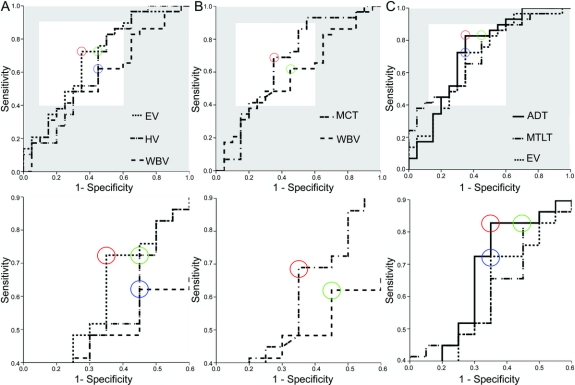
Results: Longitudinal clinical follow-up revealed that 20 participants converted to mild AD dementia (progressors) while 29 remained stable (nonprogressors) approximately 2.5 years after scanning. At baseline, QAD participants showed a milder degree of cortical thinning than typically seen in mild AD, and CDR Sum-of-Boxes correlated with thickness in temporal and parietal ROIs. Compared to nonprogressors, progressors showed temporal and parietal thinning. Using receiver operating characteristic curves, the thickness of an aggregate measure of these regions predicted progression to mild AD with 83% sensitivity and 65% specificity.
Conclusions: Thinning in specific cortical areas known to be affected by Alzheimer disease (AD) is detectable in individuals with questionable AD dementia (QAD) and predicts conversion to mild AD dementia. This method could be useful for identifying individuals at relatively high risk for imminent progression from QAD to mild AD dementia, which may be of value in clinical trials.
Figures
Comment in
-
Thin skin: the cortical signature of prodromal AD?Neurology. 2009 Mar 24;72(12):1038-9. doi: 10.1212/01.wnl.0000341312.49465.f9. Epub 2008 Dec 24. Neurology. 2009. PMID: 19109535 No abstract available.
References
-
- Killiany RJ, Gomez-Isla T, Moss M, et al. Use of structural magnetic resonance imaging to predict who will get Alzheimer’s disease. Ann Neurol 2000;47:430–439. - PubMed
-
- Dickerson BC, Goncharova I, Sullivan MP, et al. MRI-derived entorhinal and hippocampal atrophy in incipient and very mild Alzheimer’s disease. Neurobiol Aging 2001;22:747–754. - PubMed
-
- Braak H, Rub U, Schultz C, Del Tredici K. Vulnerability of cortical neurons to Alzheimer’s and Parkinson’s diseases. J Alzheimer Dis 2006;9:35–44. - PubMed
-
- Scheff SW, Price DA. Alzheimer’s disease-related alterations in synaptic density: neocortex and hippocampus. J Alzheimer Dis 2006;9:101–115. - PubMed
Publication types
MeSH terms
Substances
Grants and funding
LinkOut - more resources
Full Text Sources
Medical