. 2008 Dec 26;60(6):1022-38.
doi: 10.1016/j.neuron.2008.11.029.

Genome-wide analysis of MEF2 transcriptional program reveals synaptic target genes and neuronal activity-dependent polyadenylation site selection

Affiliations

Genome-wide analysis of MEF2 transcriptional program reveals synaptic target genes and neuronal activity-dependent polyadenylation site selection

Steven W Flavell et al. Neuron. .

Abstract

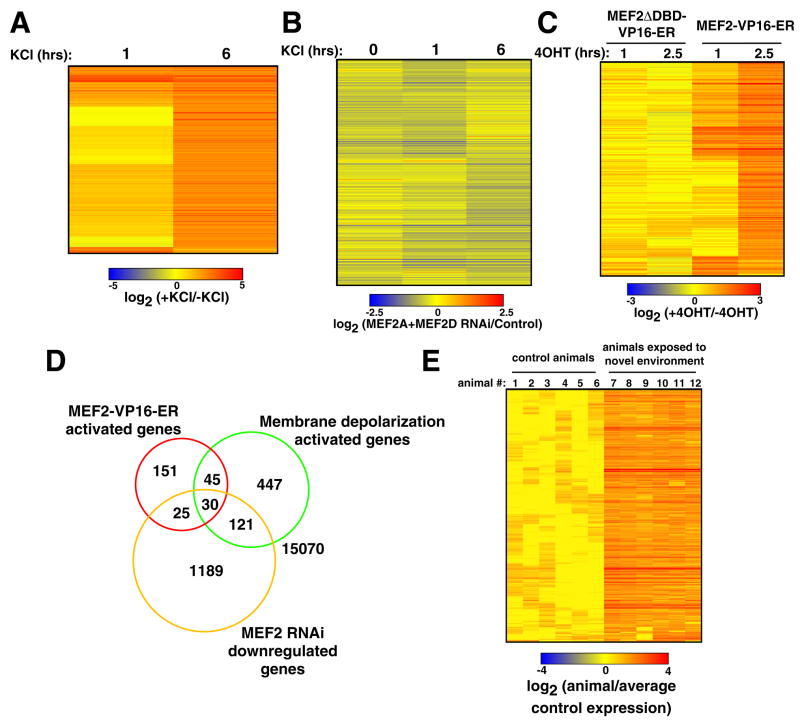
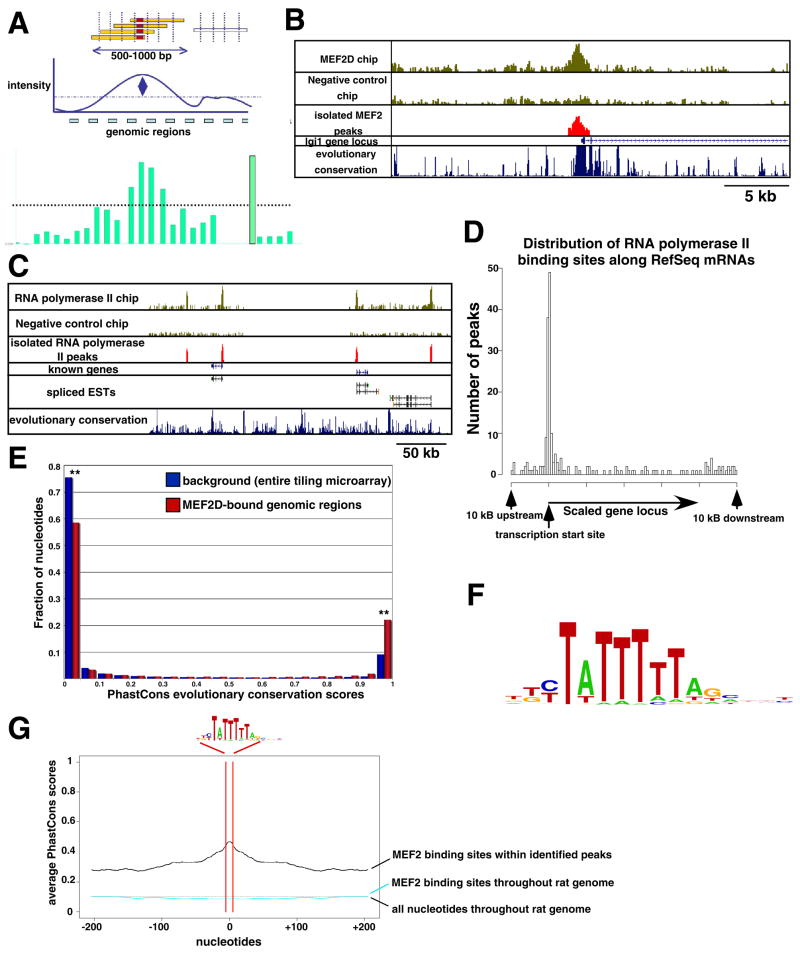
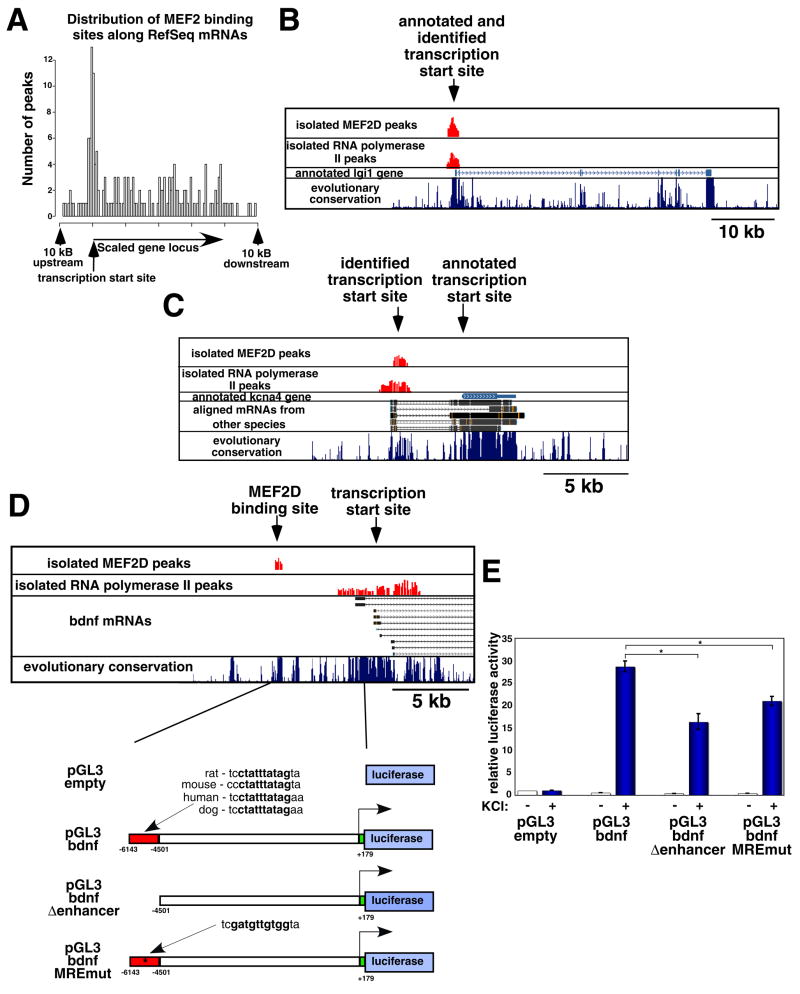
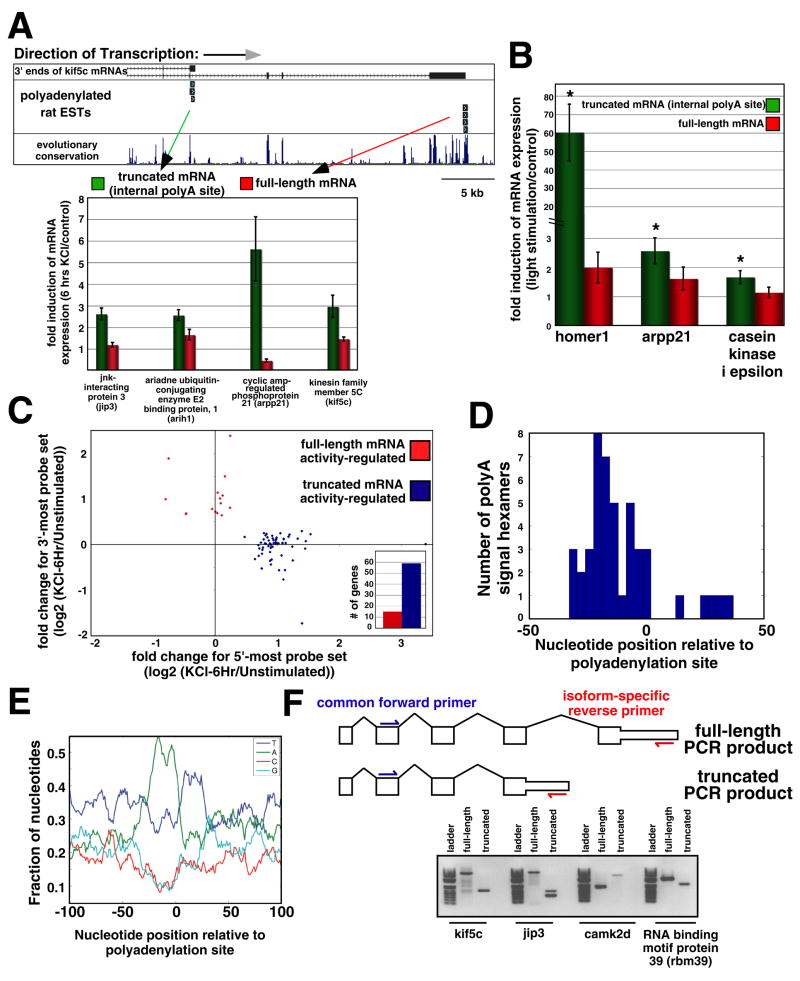
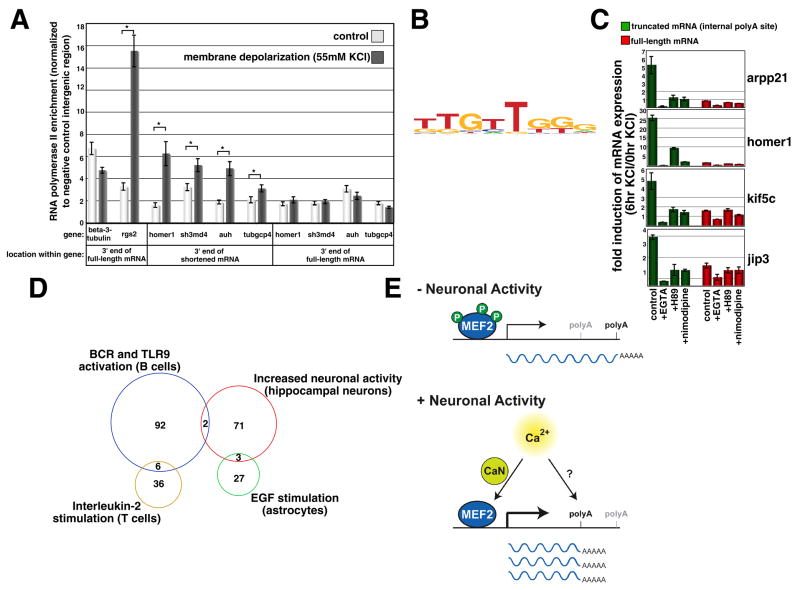
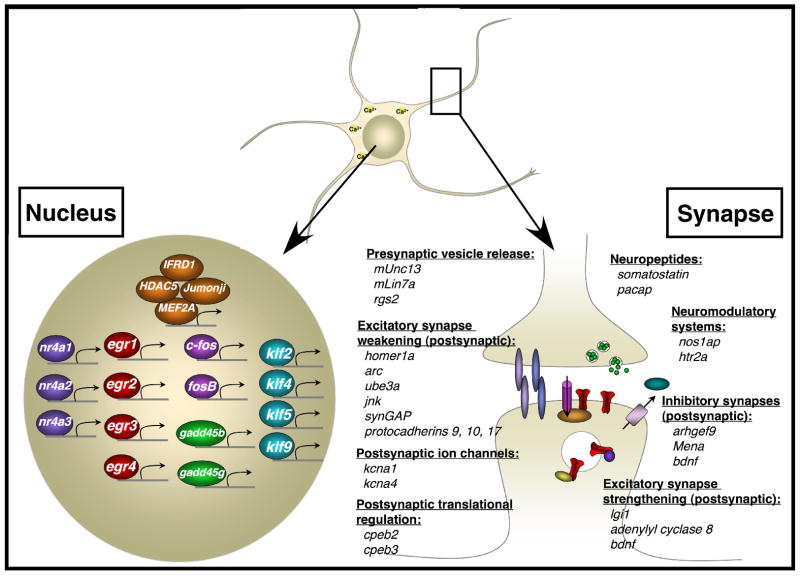
Although many transcription factors are known to control important aspects of neural development, the genome-wide programs that are directly regulated by these factors are not known. We have characterized the genetic program that is activated by MEF2, a key regulator of activity-dependent synapse development. These MEF2 target genes have diverse functions at synapses, revealing a broad role for MEF2 in synapse development. Several of the MEF2 targets are mutated in human neurological disorders including epilepsy and autism spectrum disorders, suggesting that these disorders may be caused by disruption of an activity-dependent gene program that controls synapse development. Our analyses also reveal that neuronal activity promotes alternative polyadenylation site usage at many of the MEF2 target genes, leading to the production of truncated mRNAs that may have different functions than their full-length counterparts. Taken together, these analyses suggest that the ubiquitously expressed transcription factor MEF2 regulates an intricate transcriptional program in neurons that controls synapse development.


Figures

Figure 1
Figure 1. mRNA profiling analysis reveals activity-regulated MEF2 target genes
(A) 643 probe sets whose expression is upregulated in E18+10 days in vitro (DIV) hippocampal neurons upon KCl-mediated membrane depolarization were identified by microarray analysis. Probe sets with similar expression profiles were clustered together using a Pearson correlation-based method and the expression levels of each of these probe sets (each line represents a single probe set) are displayed as a log2ratio of their expression values after one or six hours after KCl depolarization divided by their expression value in unstimulated (0 hour) cells. (B) 1365 probe sets whose expression is downregulated in E18+10 DIV hippocampal neurons in the presence of MEF2 RNAi were identified by microarray analysis. These probe sets were clustered as in (A) and expression levels are displayed as a log2ratio of their expression values in the presence of MEF2 RNAi divided by their expression values under control conditions for each of the three time points examined. (C) 251 probe sets whose expression is upregulated by 4OHT application to MEF2-VP16-ER-expressing hippocampal neurons at E18+10 DIV were identified by microarray analysis. Probe sets were clustered as in (A) and their levels of expression are displayed as the log2ratio of the expression value one or 2.5 hours after 4OHT application divided by the expression value prior to 4OHT application. (D) Venn Diagram showing the overlap of the probe sets identified in the three gene sets shown in (A–C). The levels of overlap between each of these three gene sets are statistically significant (p<0.0001 for all three comparisons, Fisher Exact Test). (E) 304 probe sets whose expression is upregulated in forebrains of rats exposed to a novel environment for three hours were identified by microarray analysis. These probe sets were clustered as in (A) and their levels of expression are displayed as the log2ratio of their expression values in each individual animal divided by the mean expression value of all control animals.
Figure 2
Figure 2. MEF2D ChIP-chip identifies MEF2 binding sites surrounding the candidate target genes
(A) Method for the identification of MEF2 binding sites by ChIP-chip. Sonicated DNA fragments enriched by MEF2D immunoprecipitation (yellow) will center on the site of MEF2D binding (red). The intensity of the signals from several consecutive probe sets on the tiling microarray that correspond to this genomic region will be identified as a peak of MEF2D binding. (B) Example of a genomic region of MEF2D occupancy identified at the lgi1 gene locus. Raw data from one representative experiment are shown in the two upper panels. The genomic region identified by our peak calling algorithm is shown in red, and the annotated RefSeq lgi1 mRNA (exons shown as blue boxes, introns shown as blue lines with arrows that indicate direction of transcription) as well as level of evolutionary conservation within this genomic region are shown below. (C) An example of genomic regions of RNA Polymerase II occupancy is shown as in (B). In addition, rat expressed sequence tags (ESTs) are shown to indicate where un-annotated mRNAs are likely to exist in this region of the rat genome. (D) Distribution of the regions of RNA Polymerase II occupancy relative to annotated RefSeq mRNAs. For this graph, the genomic loci of all genes were scaled to 40 kilobases (kb) and regions of RNA polymerase II occupancy are plotted according to their positions at or near the genes. (E) Histogram of the PhastCons evolutionary conservation scores within the entire custom tiling microarray (blue) or within the MEF2D-bound regions of the custom tiling microarray (red). These distributions are bimodal, as the majority of the nucleotides in the rat genome are either non-conserved (close to zero) or highly conserved (close to one). Asterisks are shown to indicate that these two distributions are significantly different (p<0.001, Chi-Square test). (F) Logo of the MEF2 response element (MRE) that was identified as significantly enriched within the MEF2-bound genomic regions. (G) Mean PhastCons scores of genomic regions surrounding each occurrence of the MRE in (F) are shown. The nucleotides corresponding to the MRE are between the red lines, whereas the 400 nucleotides adjacent to each MRE surround the red lines. Mean PhastCons scores are shown for regions surrounding MREs within the MEF2D-bound regions of the tiling microarry (black) or within random regions of the rat genome (cyan). The mean PhastCons scores of all the nucleotides in the rat genome are also displayed (dotted black line). The PhastCons scores of the MREs within the MEF2D-bound regions are significantly higher than those within random regions of the rat genome (p<0.01, Chi-Square test).
Figure 3
Figure 3. Location of the genomic regions of MEF2D occupancy at MEF2-regulated genes
(A) Distribution of the regions of MEF2D occupancy along the MEF2-regulated genes, plotted as in Fig. 2D. (B) Example of a region of MEF2D occupancy that was identified within the proximal promoter of a MEF2-regulated gene (lgi1). The identified regions of MEF2D and RNA Polymerase II occupancy are shown in red, along with the annotated lgi1 gene and the level of evolutionary conservation within this genomic region. (C) Example of a region of MEF2D occupancy that was detected at a site of RNA Polymerase II occupancy upstream of the 5′ end of a RefSeq annotated mRNA (kcna4). (D) Example of a region of MEF2D occupancy detected far upstream (~6.5 kb) of the annotated transcriptional start site (TSS) of a MEF2-regulated gene (bndf). This genomic region was cloned into the luciferase reporter constructs that are depicted below (MEF2-bound region is depicted as a red box). (E) Normalized luciferase activity in lysates from E18+6 DIV hippocampal neurons that were transfected with the indicated luciferase reporter constructs and either treated with elevated levels of extracellular KCl (blue) or left untreated (white). Data are shown as means ± standard error of the mean (SEM). P<0.01, two-factor analysis of variance (ANOVA); asterisks indicate statistical significance in pairwise comparison: P<0.01, Bonferroni-Dunn post-hoc test.
Figure 4
Figure 4. Neuronal activity-dependent alternative polyadenylation site usage
(A) Upper: example of a gene (kif5c) that was identified through microarray analyses to display an activity-dependent change in polyA site usage. Rat ESTs that were sequenced with polyA tails intact are shown at the 3′ ends of the two kif5c mRNAs that were independently measured on the RAE230.2 micoarray. Lower: RT-qPCR confirmation of these microarray results for four genes. Expression of each gene was measured through two distinct primer sets that correspond to different 3′ ends of mRNAs produced by the gene that were independently represented on the microarray. Expression of these genes was normalized to that of beta-3-tubulin and data are shown as means ± SEM. (B) RT-qPCR analysis conducted as in (A). Gene expression in these experiments was measured in neurons in primary visual cortex in both control animals and animals that had been acutely exposed to light stimulation. Expression of these genes was normalized to that of beta-3-tubulin and data are shown as means ± SEM. Asterisk indicates significant increase in mRNA expression (p<0.05, t-test) in animals exposed to visual stimulation versus dark-reared control animals. None of the full-length mRNAs showed a significant change by these same criteria. (C) Changes in gene expression in response to 6 hours of KCl treatment for truncated and full-length mRNAs produced by individual genes. All genes that were identified through microarray analysis as having disparate expression data between two or more probe sets mapping to the same gene are displayed. There is a strong bias for the activity-regulated probe set to correspond to the truncated mRNA (blue) rather than the full-length mRNA (red). Inset: number of genes belonging to these two categories. (D) Distribution of polyA signal hexamers surrounding the polyA regions. The exact locations of 19 polyA sites that in depth analyses indicated were high confidence sites of activity-dependent polyadenylation were used in this analysis. The polyA signal hexamers that were acceptable in our analysis were those identified by Tian et al. (2005). (E) Nucleotide density at the genomic regions surrounding the polyA sites that display activity-dependent use. Same polyA sites that were analyzed in (D) were used here. (F) Above: cartoon depicting a generic gene that has two distinct mRNA isoforms with different 3′ ends. For four such genes, RT-PCR was performed with two primer sets. For each gene, the primer sets shared the same forward primer in a 5′ exon within the gene, but had different isoform-specific reverse primers, as is shown. Using a cDNA template prepared from hippocampal neuron RNA, all RT-PCR reactions yielded products of the correct predicted length (below). Note that two distinct splice forms (corresponding to two bands) of the short jip3 transcript were amplified; also note that the 3′UTR of the truncated camk2d isoform is especially long, so that this mRNA is larger than the full-length isoform even though it lacks several 3′ protein-coding exons.
Figure 5
Figure 5. Features of polyA regions that display activity-dependent use
(A) Data from two independent ChIP experiments conducted with an antibody against the elongating form of RNA polymerase II are shown as levels of RNA polymerase II enrichment at the indicated locations in the mouse genome, normalized to a negative control intergenic region that does not display RNA polymerase II occupancy. Note that analyses of microarray data (Fig. 1) indicate activity-dependent polyA site switching at homer1, while polyA site switching at sh3 multiple domains 4 (sh3md4), AU RNA binding protein/enoyl-Coenzyme A Hydratase (auh) and tubulin, gamma complex associated protein 4 (tubgcp4) is indicated by additional expression analyses (data not shown). Data are shown as means ± SEM; asterisk indicates statistically significant increase in RNA polymerase II occupancy for a given genomic region (p<0.01, Two-Factor ANOVA). (B) Logo of a novel motif that was identified as highly enriched in the regions surrounding the truncated polyA regions. (C) RT-qPCR analysis of mRNA expression of the indicated truncated and full-length mRNAs. The fold induction of mRNA expression was analyzed in response to six hours of membrane depolarization in the absence or presence of the indicated inhibitors. Data from one representative experiment are shown as means ± SEM. (D) Sets of genes identified through microarray analysis as displaying polyA site switching in response to different extracellular stimuli. Note that there is almost no overlap between these different sets of genes. (E) Model for activity-regulated polyadenylation site switching. At several MEF2 target genes, and other genes that display activity-dependent transcription, neuronal activity promotes both increased levels of transcription and increased usage of internal polyadenylation sites, which leads to a robust increase in the abundance of short mRNAs that differ from the full-length mRNAs produced in the absence of neuronal activity. The calcium-dependent activation of MEF2 is mediated in large part through the calcineurin (CaN)-dependent dephosphorylation of MEF2 proteins, while calcium-dependent polyadenylation site switching is mediated through signal transduction pathways that remain unknown. Note that although these processes are coupled at individual genes (like the gene depicted in the model), the signaling pathways that lead to activity-dependent transcription and polyA site switching might be completely independent.
Figure 6
Figure 6. MEF2 target genes that function at the synapse and in the nucleus
The list of newly identified MEF2 target genes was enriched for genes that encode transcriptional regulators and for genes that encode proteins that function at the synapse. Several examples of these types of genes are shown. See main text for additional details.

References

    1. Aizawa H, Hu SC, Bobb K, Balakrishnan K, Ince G, Gurevich I, Cowan M, Ghosh A. Dendrite development regulated by CREST, a calcium-regulated transcriptional activator. Science. 2004;303:197–202. - PubMed
    1. Barbosa AC, Kim MS, Ertunc M, Adachi M, Nelson ED, McAnally J, Richardson JA, Kavalali ET, Monteggia LM, Bassel-Duby R, Olson EN. MEF2C, a transcription factor that facilitates learning and memory by negative regulation of synapse numbers and function. Proc Natl Acad Sci U S A 2008 - PMC - PubMed
    1. Barco A, Alarcon JM, Kandel ER. Expression of constitutively active CREB protein facilitates the late phase of long-term potentiation by enhancing synaptic capture. Cell. 2002;108:689–703. - PubMed
    1. Boehm S, Betz H. Somatostatin inhibits excitatory transmission at rat hippocampal synapses via presynaptic receptors. J Neurosci. 1997;17:4066–4075. - PMC - PubMed
    1. Chen C, Regehr WG. Developmental remodeling of the retinogeniculate synapse. Neuron. 2000;28:955–966. - PubMed

Publication types

MeSH terms

Substances