Comparative Study
. 2008 Dec 26;60(6):1126-41.
doi: 10.1016/j.neuron.2008.10.043.

Matching categorical object representations in inferior temporal cortex of man and monkey

Affiliations
Comparative Study

Matching categorical object representations in inferior temporal cortex of man and monkey

Nikolaus Kriegeskorte et al. Neuron. .

Abstract

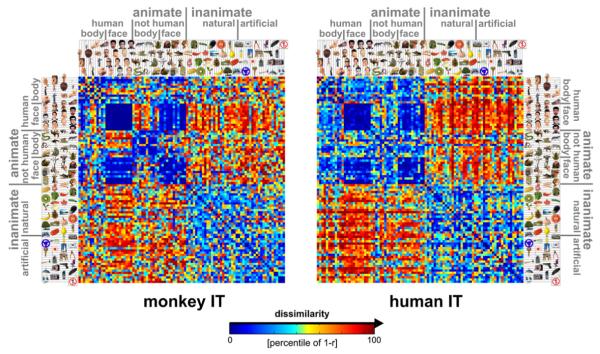
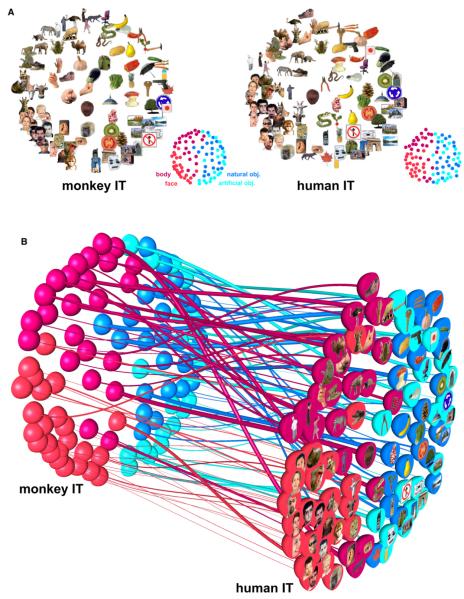
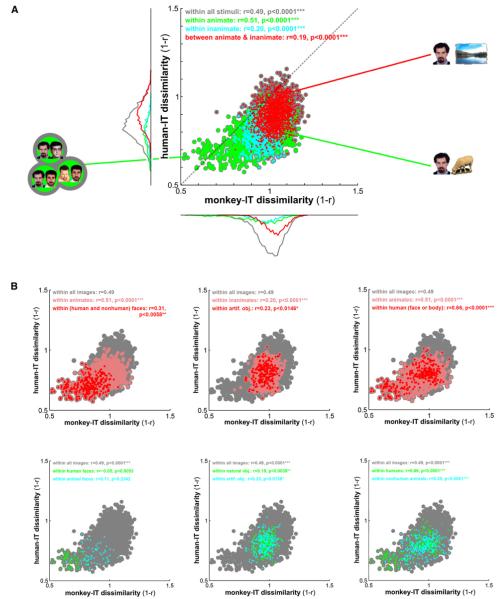
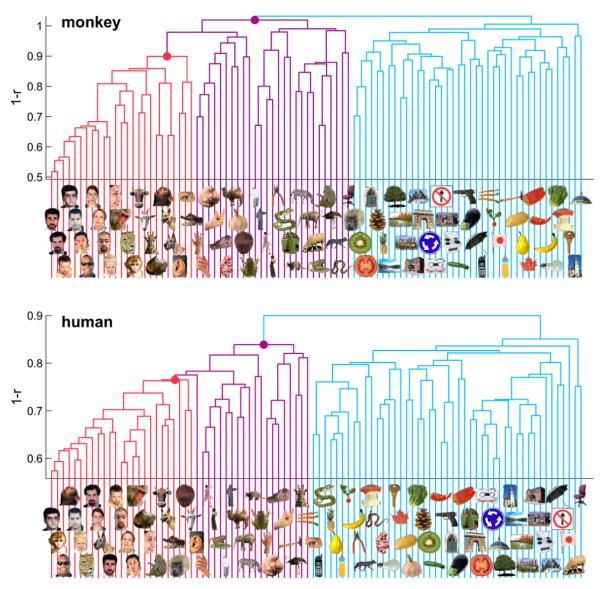
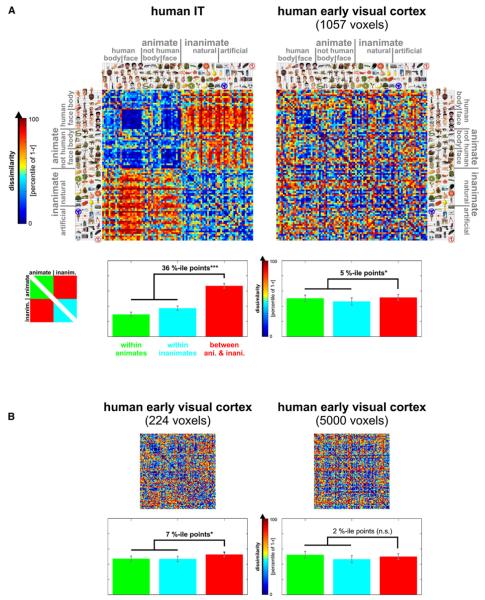
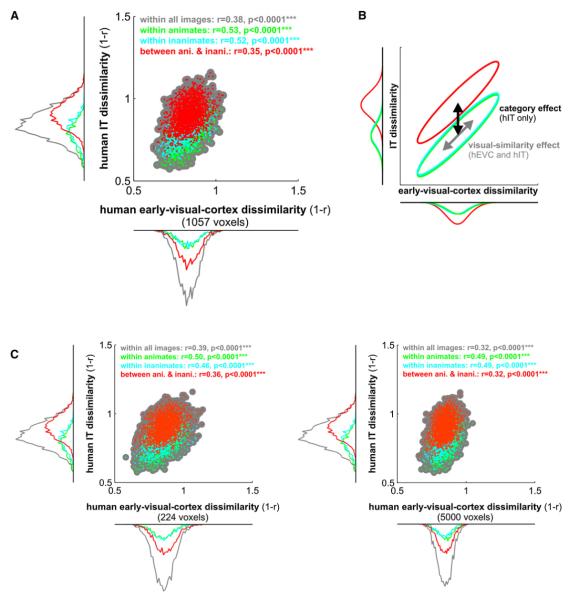
Inferior temporal (IT) object representations have been intensively studied in monkeys and humans, but representations of the same particular objects have never been compared between the species. Moreover, IT's role in categorization is not well understood. Here, we presented monkeys and humans with the same images of real-world objects and measured the IT response pattern elicited by each image. In order to relate the representations between the species and to computational models, we compare response-pattern dissimilarity matrices. IT response patterns form category clusters, which match between man and monkey. The clusters correspond to animate and inanimate objects; within the animate objects, faces and bodies form subclusters. Within each category, IT distinguishes individual exemplars, and the within-category exemplar similarities also match between the species. Our findings suggest that primate IT across species may host a common code, which combines a categorical and a continuous representation of objects.


Figures

Figure 1
Figure 1. Representational Dissimilarity Matrices for Monkey and Human IT
For each pair of stimuli, each RDM (monkey, human) color codes the dissimilarity of the two response patterns elicited by the stimuli in IT. The dissimilarity measure is 1 – r (Pearson correlation across space). The color code reflects percentiles (see color bar) computed separately for each RDM (for 1 – r values and their histograms, see Figure 3A). The two RDMs are the product of completely separate experiments and analysis pipelines (data not selected to match). Human data are from 316 bilateral inferior temporal voxels (1.95 × 1.95 × 2mm3) with the greatest visual-object response in an independent data set. For control analyses using different definitions of the IT region of interest (size, laterality, exclusion of category-sensitive regions), see Figures S9–S11. RDMs were averaged across two sessions for each of four subjects. Monkey data are from 674 IT single cells isolated in two monkeys (left IT in one monkey, right in the other; Kiani et al., 2007).
Figure 2
Figure 2. Stimulus Arrangements Reflecting IT Response-Pattern Similarity in Monkey and Human and the Interspecies Relationship
(A) The experimental stimuli have been arranged such that their pairwise distances approximately reflect response-pattern similarity (multidimensional scaling, dissimilarity: 1 – Pearson r, criterion: metric stress). In each arrangement, images placed close together elicited similar response patterns. Images placed far apart elicited dissimilar response patterns. The arrangement is unsupervised: it does not presuppose any categorical structure. The two arrangements have been scaled to match the areas of their convex hulls and rigidly aligned for easier comparison (Procrustes alignment). The correlations between the high-dimensional response-pattern dissimilarities (1 – r) and the two-dimensional Euclidean distances in the figure are 0.67 (Pearson) and 0.69 (Spearman) for monkey IT and 0.78 (Pearson) and 0.78 (Spearman) for human IT. (B) Fiber-flow visualization emphasizing the interspecies differences. This visualization combines all the information from (A) and links each pair of dots representing a stimulus in monkey and human IT by a “fiber.” The thickness of each fiber reflects to what extent the corresponding stimulus is inconsistently represented in monkey and human IT. The interspecies consistency ri of stimulus i is defined as the Pearson correlation between vectors of its 91 dissimilarities to the other stimuli in monkey and human IT. The thickness of the fiber for stimulus i is proportional to (1 – ri)2, thus emphasizing the most inconsistently represented stimuli. The analysis of single-stimulus interspecies consistency is pursued further in Figures S2 and S3.
Figure 3
Figure 3. Correlation of Representational Dissimilarities between Monkey and Human IT
(A) For each pair of stimuli, a dot is placed according to the IT response-pattern dissimilarity in monkey (horizontal axis) and human (vertical axis). As before, the dissimilarity between the two response patterns elicited by each stimulus pair is measured as 1 – r (Pearson correlation). Dot colors correspond to all pairs of stimuli (gray), pairs within the animate objects (green), pairs within the inanimate objects (cyan), and pairs crossing the animate-inanimate boundary (red). Marginal histograms of dissimilarities are shown for the three subsets of pairs using the same color code. For detailed exploratory analysis of the species differences, Figures S13 and S14 show the stimulus pairs corresponding to the dots for the three apical regions of the scatter plot. (B) The same analysis as in (A), but for within-category correlations between human and monkey-IT object dissimilarities. Colored dots correspond to all pairs of stimuli (gray) or pairs within stimulus-category subsets (colors). In the top row, each panel shows the whole set (gray), a subset (pink), and a subset nested within that subset (red), as indicated in the colored legend of each panel. In the bottom row, each panel shows the whole set (gray) and two disjointed subsets (green and cyan), as indicated in the colored legend of each panel. In both (A) and (B), each panel’s color legend (top inset) also states the correlations (r, Pearson) between monkey and human-IT dissimilarities and their significance (*p < 0.05, **p < 0.01, ***p < 0.001). The dissimilarity correlations are tested by randomization of the stimulus labels. This test correctly handles the dependency structure within each RDM. All p values < 0.0001 are stated as p < 0.0001 because the randomization test terminates after 10,000 iterations.
Figure 4
Figure 4. Hierarchical Clustering of IT Response Patterns
In order to assess whether IT response patterns form clusters corresponding to natural categories, we performed hierarchical cluster analysis for human (top) and monkey (bottom). This analysis proceeds from single-image clusters (bottom of each panel) and successively combines the two clusters closest to each other in terms of the average response-pattern dissimilarity, so as to form a hierarchy of clusters (tree structure in each panel). The vertical height of each horizontal link indicates the average response-pattern dissimilarity (the clustering criterion) between the stimuli of the two linked subclusters (dissimilarity: 1 – r). The cluster trees for monkey and human are the result of completely independent experiments and analysis pipelines. This data-driven technique reveals natural-category clusters that are consistent between monkey and human. For easier comparison, we colored subcluster trees (faces, red; bodies, magenta; inanimate objects, light blue). Early visual cortex (Figures 5, 6, and S5) and low-level computational models (Figures S6 and S7) did not reveal such category clusters.
Figure 5
Figure 5. Early Visual Cortex and IT in the Human: Representational Dissimilarity Matrices and Category-Boundary Effects
(A) RDMs for human IT (top left, same as in Figure 1) and human early visual cortex (top right). As in Figure 1, the color code reflects percentiles (see color bar) computed separately for each RDM (for 1 – r values and their histograms, see Figure 6). The bar graph below each RDM shows the average dissimilarity (percentile of 1 – r) within the animates (green bars), within the inanimates (cyan bars), and for pairs crossing the category boundary (red bars). Error bars indicate the standard error of the mean estimated by bootstrap resampling of the stimulus set. We define the category-boundary effect as the difference (in percentile points) between the mean dissimilarity for between-animate-and-inanimate pairs and the mean dissimilarity for within-animate and within-inanimate pairs. The zeros on the diagonal are excluded in computing these means. The category-boundary effect sizes are given above the bars in each panel with significant effects marked by stars (p ≥ 0.05 indicated by n.s. for “not significant,” *p < 0.05, **p < 0.01, ***p < 0.001). The p values are from a bootstrap test; a randomization test yields the same pattern of significant effects (see Results). Here, as in Figures 1-4, human IT has been defined at 316 voxels (for IT at 100–10,000 voxels, see Figure S10) and human early visual cortex at 1057 voxels. (B) The same analyses for smaller and larger definitions of human early visual cortex (224 and 5000 voxels, respectively).
Figure 6
Figure 6. Representational Connectivity between Early Visual Cortex and IT in the Human
(A) For each pair of stimuli, we plot a dot with horizontal position reflecting early visual response-pattern dissimilarity and vertical position reflecting IT response-pattern dissimilarity. Scatter plots and correlation analyses (insets) show that pairs of stimuli eliciting more dissimilar response patterns in early visual cortex also tend to elicit more dissimilar response patterns in IT. This suggests that visual similarity as reflected in the early visual representation carries over into the IT representation. However, IT additionally exhibits a strong category-boundary effect: when a stimulus pair crosses the animate-inanimate boundary (red) the two response patterns tend to be more dissimilar than when both stimuli are from the same category (green, cyan). The category-boundary effect is evident in the marginal dissimilarity histograms framing the scatter plot (for statistical analysis, see Figure 5). (B) In this conceptual diagram, the distributions from the scatter plots are depicted as ellipsoids (iso-probability-density contours) with the same color code. The visual-similarity effect is shared between early visual and IT representations (each distribution diagonally elongated), whereas the category-boundary effect is only present in IT (red distribution vertically, but not horizontally shifted with respect to the within-category distributions). (C) The same analyses for smaller and larger definitions of human early visual cortex (224 and 5000 voxels, respectively) show that the findings above do not depend on the size of the early visual region of interest.

References

    1. Afraz SR, Kiani R, Esteky H. Microstimulation of inferotemporal cortex influences face categorization. Nature. 2006;442:692–695. - PubMed
    1. Aguirre GK. Continuous carry-over designs for fMRI. Neuroimage. 2007;35:1480–1494. - PMC - PubMed
    1. Aguirre GK, Zarahn E, D’Esposito M. An area within human ventral cortex sensitive to “building” stimuli: evidence and implications. Neuron. 1998;21:373–383. - PubMed
    1. Baker CI, Behrmann M, Olson CR. Impact of learning on representation of parts and wholes in monkey inferotemporal cortex. Nat. Neurosci. 2002;5:1210–1216. - PubMed
    1. Bodurka J, Ye F, Petridou N, Murphy K, Bandettini PA. Mapping the MRI voxel volume in which thermal noise matches physiological noise-Implications for fMRI. Neuroimage. 2007;34:542–549. - PMC - PubMed

Publication types

LinkOut - more resources