. 2008 Dec 26;60(6):1153-68.
doi: 10.1016/j.neuron.2008.12.003.

Similarity effect and optimal control of multiple-choice decision making

Affiliations

Similarity effect and optimal control of multiple-choice decision making

Moran Furman et al. Neuron. .

Abstract

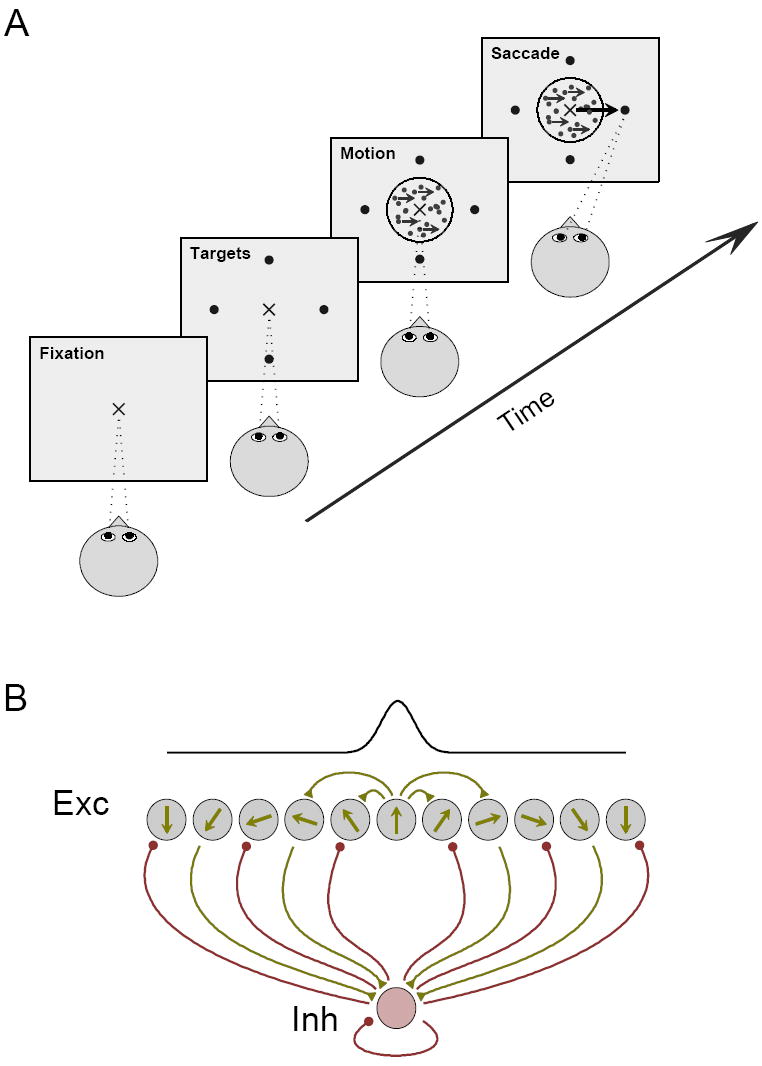
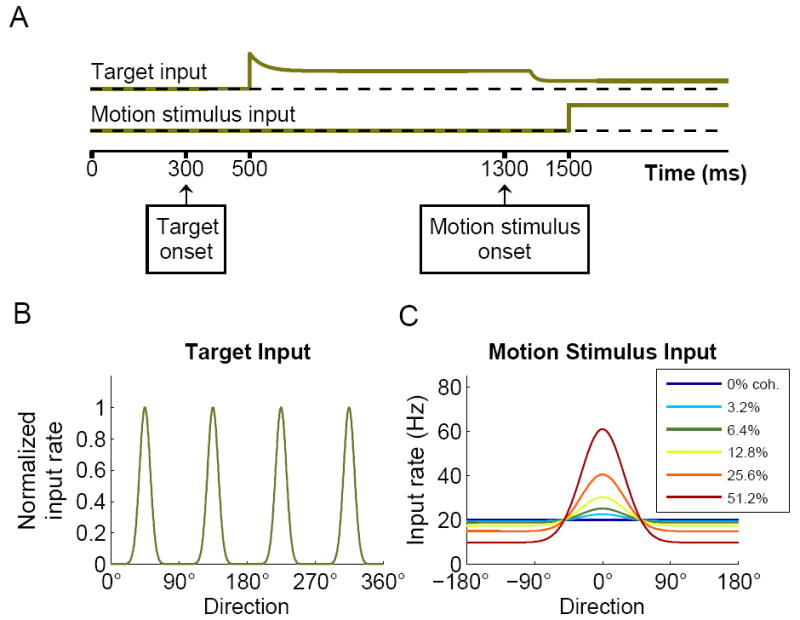
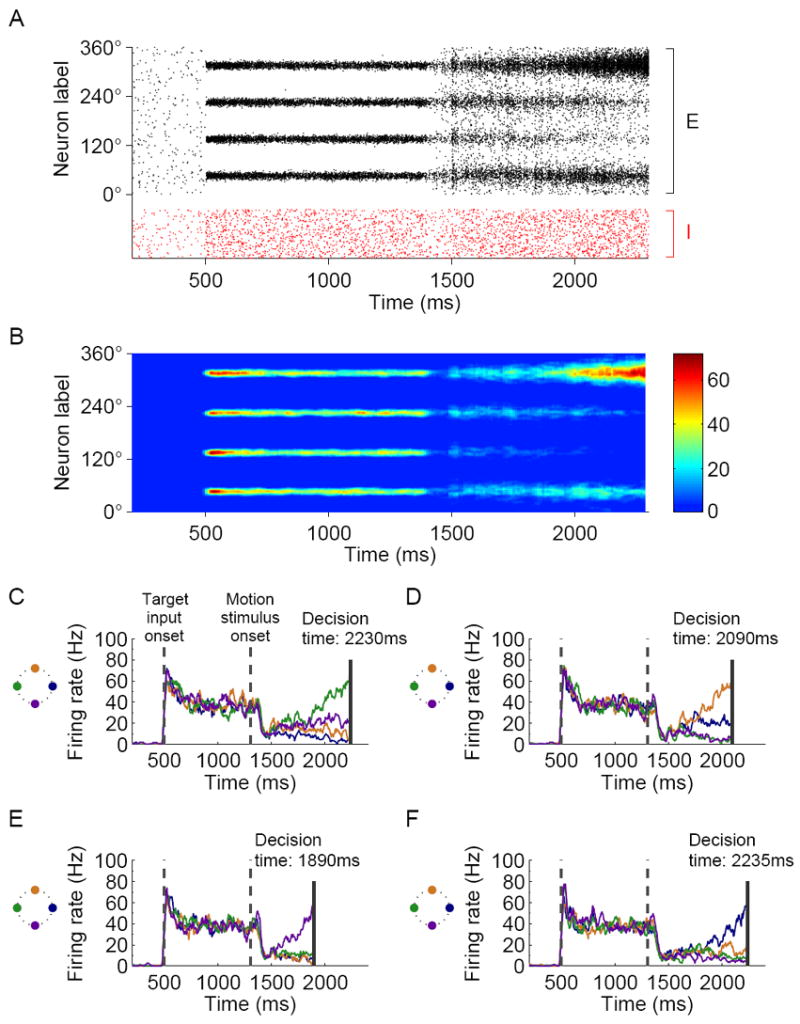
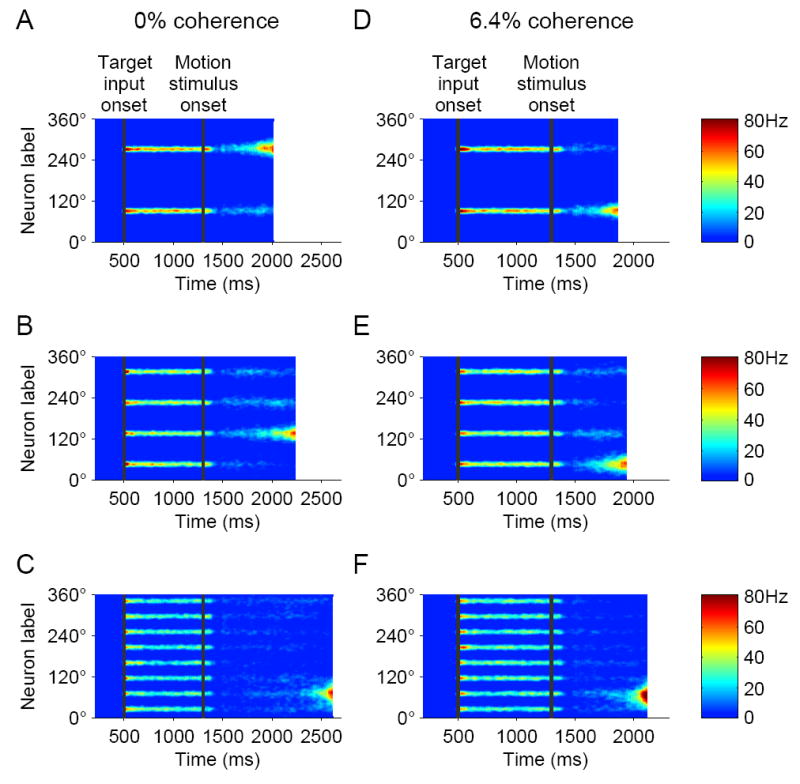
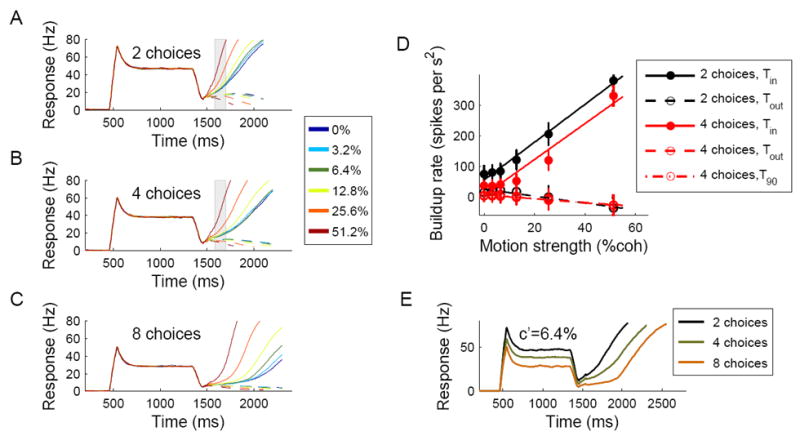
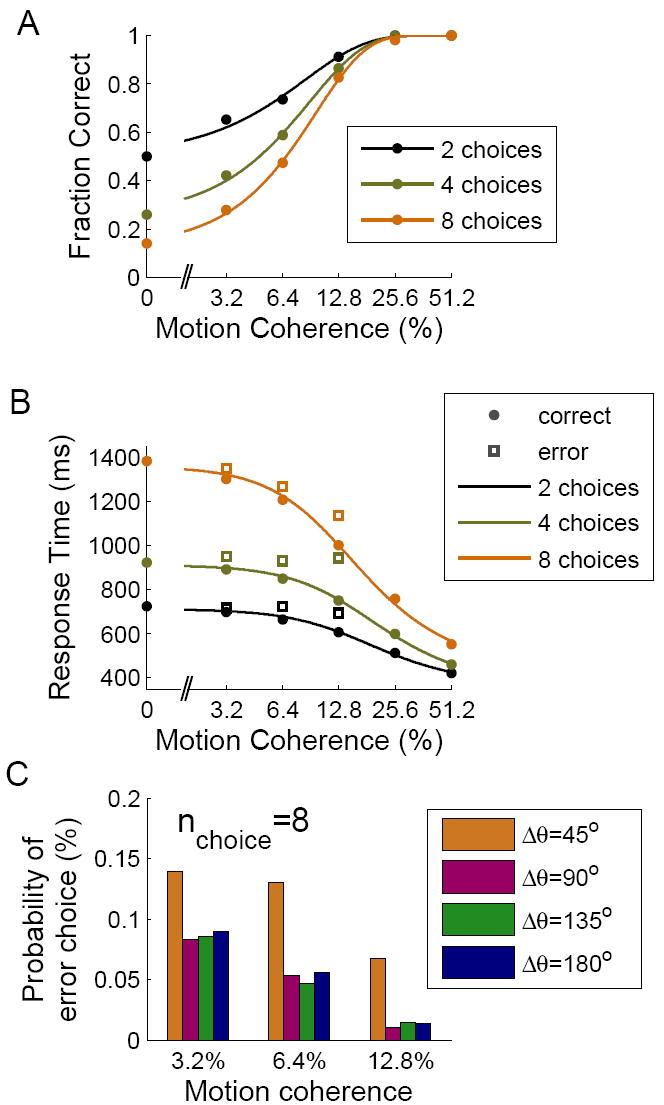
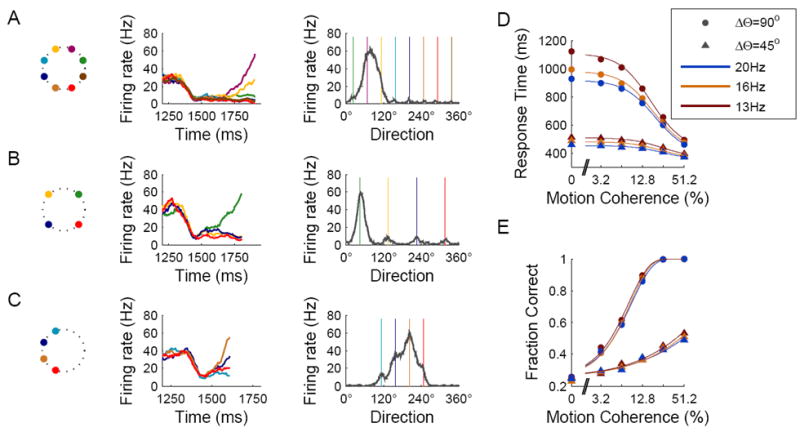
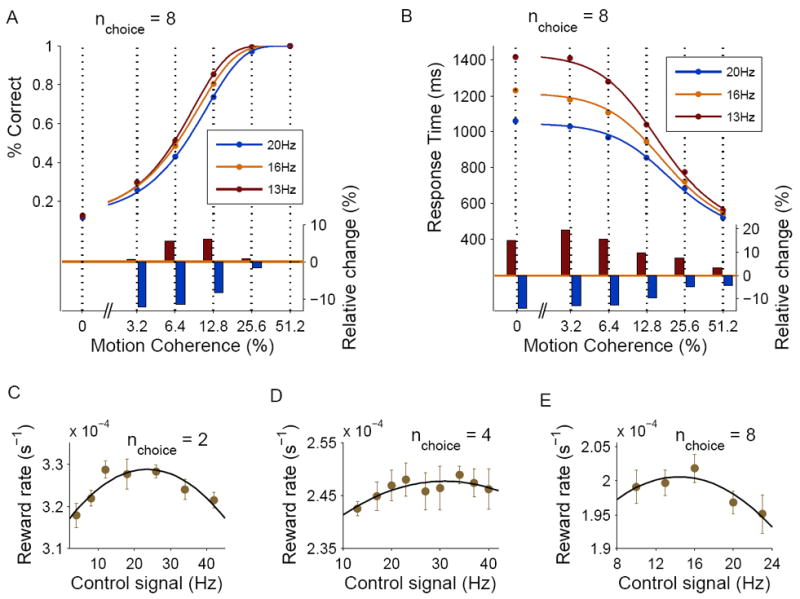
Decision making with several choice options is central to cognition. To elucidate the neural mechanisms of such decisions, we investigated a recurrent cortical circuit model in which fluctuating spiking neural dynamics underlie trial-by-trial stochastic decisions. The model encodes a continuous analog stimulus feature and is thus applicable to multiple-choice decisions. Importantly, the continuous network captures similarity between alternatives and possible overlaps in their neural representation. Model simulations accounted for behavioral as well as single-unit neurophysiological data from a recent monkey experiment and revealed testable predictions about the patterns of error rate as a function of the similarity between the correct and actual choices. We also found that the similarity and number of options affect speed and accuracy of responses. A mechanism is proposed for flexible control of speed-accuracy tradeoff, based on a simple top-down signal to the decision circuit that may vary nonmonotonically with the number of choice alternatives.


Figures

Figure 1
Figure 1
The multiple-choice motion discrimination task and network architecture. (A) In the task, the subject fixates, and is then presented with a number of peripheral targets indicating the choice alternatives. After a delay, a dynamic random-dots array appears. A fraction of the dots move coherently in the direction toward one of the targets, while the remaining dots move at random directions. When ready to respond, the subject reports the perceived net direction of motion by making a saccadic eye movement to the corresponding target. (B) Schematic description of the spiking neuron network model. The network is composed of spiking pyramidal cells and inhibitory interneurons. Pyramidal cells are directionally selective and are spatially arranged according to their preferred directions. The connectivity strength between pyramidal cells is a Gaussian function of the difference between their preferred directions. For the sake of simplicity, connections to and from the interneurons are non selective. Recurrent excitation in the model underlies accumulation of sensory information over time, while feedback inhibition mediates competition between the choice alternatives and categorical decision formation.
Figure 2
Figure 2
Simulation protocol. (A) Schematic time course of the input signals. The input signals represent sensory information acquired during the task, and are implemented by rate-modulated Poisson spike trains projecting to the neurons in the network. The targets are presented at 300ms and the corresponding signal to the network is activated after a latency of 200ms. The target-input has a transient phase, to model spike-rate adaptation of the input neurons, followed by tonic activity. The motion stimulus is presented at 1300ms, resulting first in a reduction of the target-input (after a latency of 80 ms), and then in activation of the motion stimulus input to the decision circuit after a latency of 200 ms. (B) Normalized spatial profile of the target-input with four choice options. (C) Spatial profile of the motion stimulus input for different coherence levels, as function of direction relative to the coherent motion.
Figure 3
Figure 3
Simulated neural activity during sample trials with 4 choices and 0% coherence level. (A) Spiking activity of the pyramidal (black) and inhibitory (red) neurons in the model. Pyramidal neurons are arranged along the ordinate according to their preferred direction. The directions of the targets are 45°, 135°, 225° and 315°. (B) Color-coded activity of the pyramidal neurons in (A) after smoothing (see Experimental Procedures). (C-F) Activity time course of neurons located around the targets in four sample trials. The colors of the traces correspond to the targets in the schematic illustration of target locations (left). Similar to neural data from LIP, neurons located around the targets respond vigorously to the presence of the targets even before the onset of the motion stimulus. When the motion stimulus is presented, firing activity shows an initial dip, which in the model is assumed to arise from divided attention between the target and the motion stimuli. During the decision process the network displays competitive dynamics, and eventually, the activity of a group of neurons ramps up and reaches the preset decision threshold (solid vertical line). Due to stochastic firing within the network, both the winning neural pool (hence the choice) and the response time vary from trial to trial even when the stimulus condition remains unchanged.
Figure 4
Figure 4
Network activity dynamics in sample simulations with 2, 4 and 8 choices, at 0% coherence (A-C) and 6.4% coherence (D-F). When the number of choices is increased, the input signal representing the targets is modified accordingly, but the motion stimulus input and all the network parameters remain unchanged. Thus, the same circuit underlies decision making in the motion discrimination task independently of the number of choices.
Figure 5
Figure 5
Time course of neural firing and activity buildup during the decision process. (A-C) Activity of neurons located around the selected target (solid lines) and in the opposite direction (dashed lines) during simulations with 2, 4 and 8 choices, respectively. Different colors denote different coherence levels. Each plot was obtained by averaging neural activity over 200 correct trials. (D) Activity buildup rates with 2 and 4 choices, calculated over the epoch indicated by a shaded rectangle in (A) and (B). The buildup rate for neurons located around the selected target increased quasi-linearly as a function of the coherence level. Increasing the number of choices from 2 to 4 resulted in lower buildup rates, but the slope of the buildup vs. coherence remains approximately unchanged, as observed in LIP neurons in the monkey experiment (Churchland et al., 2008). (E) Activity of neurons around the selected target during simulations with 6.4% coherence and different number of targets. Similar to findings from LIP neurons, the spiking response to the targets was reduced when the number of targets was increased, resulting in a lower dip of activity and larger excursion from baseline to threshold during motion stimulus presentation.
Figure 6
Figure 6
Simulated behavioral data. (A) Performance as a function of motion coherence. Except for the highest coherence levels, performance decreases with increasing number of choice options. (B) Mean response times as a function of coherence on correct (circles) and error (squares) trials. Decisions take longer times to achieve with a larger number of choice options. For (A-B), the control signal in these simulations was 6Hz, 20Hz and 16Hz for 2, 4 and 8 choices, respectively. (C) Spatial distribution of errors in simulations with 8 choices. The histograms show the probability of choosing a target at different angular distances Δθ from the correct target, at coherence levels 3.2%, 6.4% and 12.8%. Due to lateral interactions in the network, the probability of making an erroneous choice to a target adjacent to the correct one was higher than for the other targets.
Figure 7
Figure 7
Similarity effect and overlaps in the neural representation of targets. (A-C) Responses during sample simulation with 8 targets separated by 45° (A), 4 targets separated by 90° (B), and 4 targets separated by 45° (C). Left: Schematic illustration of target locations. Middle: Activity dynamics of neural pools located around the targets (color coding as in Fig. 3). Right: Activity profile at the decision time (colored lines indicate target locations). In many of the simulations with 45° separation (panels A and C; see text) activity buildup occurred around more than one target, resulting in merging of activity-bumps around adjacent targets. (D,E) Response times (D) and performance (E) as a function of motion coherence for 4 targets separated by either 90° (dots) or 45° (triangles). In the 45° targets separation case, recurrent excitation between neural pools that were involved in merging of activity buildup resulted in acceleration of the network dynamics. Different colors denote three magnitudes of the control signal, which can be used to adjust response times and performance.
Figure 8
Figure 8
Speed-accuracy tradeoff and optimization of the decision-making process. (A) Top: Performance as a function of the motion coherence in simulations with 8 choices, for three values of the control signal. Bottom: Relative change in performance for control signals of 13Hz and 20Hz relative to 16Hz. (B) Response times as a function of the motion coherence, same conventions as in (A). (C-E) Dependence of the mean reward rate on the control signal level in simulations with 2, 4 and 8 choices respectively. The optimal control level (corresponding to maximum reward rate) has a non-monotonic dependence on the number of choice options, due to similarity effects (see text). Each point is calculated from a block of trials with a uniform distribution of coherence levels. The reward rate R is defined as R = P/T, where P is the average performance and T is the average trial time duration (see Supplemental Experimental Procedures). Error bars indicate SEM.

Comment in

References

    1. Ashby FG, Perrin NA. Toward a unified theory of similarity and recognition. Psychological Review. 1988;95:124–150.
    1. Bartos M, Vida I, Frotscher M, Geiger JRP, Jonas P. Rapid signaling at inhibitory synapses in a dentate gyrus interneuron network. Journal of Neuroscience. 2001;21:2687–2698. - PMC - PubMed
    1. Basso MA, Wurtz RH. Modulation of neuronal activity in superior colliculus by changes in target probability. Journal of Neuroscience. 1998;18:7519–7534. - PMC - PubMed
    1. Beck JM, Ma WJ, Kiani R, Hanks T, Churchland AK, Roitman J, Shadlen MN, Latham PE, Pouget A. Probabilistic population codes for Bayesian decision making. Neuron. 2008 in press. - PMC - PubMed
    1. Ben-Yishai R, Bar-Or RL, Sompolinsky H. Theory of orientation tuning in visual cortex. Proceedings of the National Academy of Sciences USA. 1995;92:3844–3848. - PMC - PubMed

Publication types

MeSH terms

Substances

LinkOut - more resources