. 2009 Mar;61(3):548-59.
doi: 10.1002/mrm.21875.

Mapping of brain metabolite distributions by volumetric proton MR spectroscopic imaging (MRSI)

Affiliations

Mapping of brain metabolite distributions by volumetric proton MR spectroscopic imaging (MRSI)

A A Maudsley et al. Magn Reson Med. 2009 Mar.

Abstract

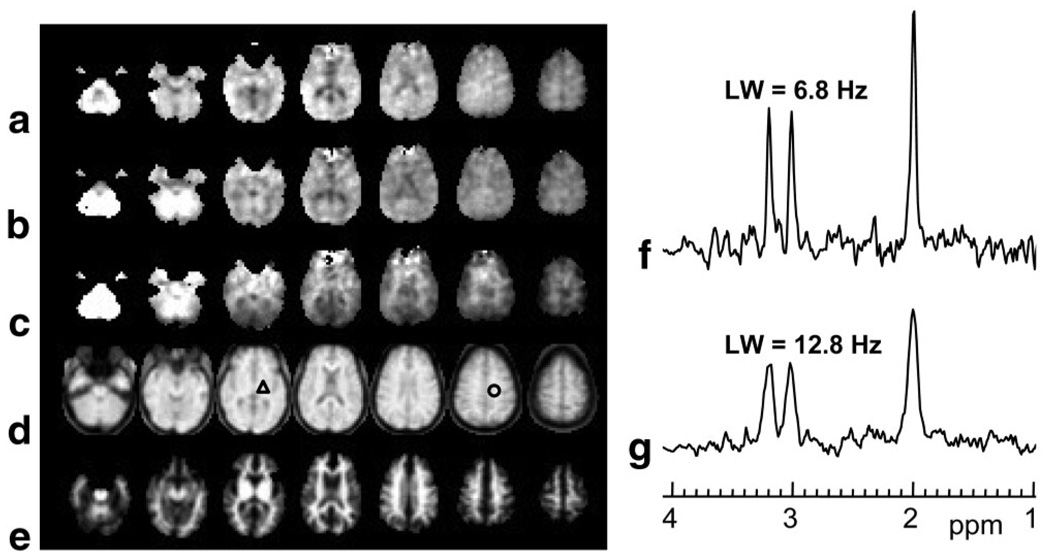
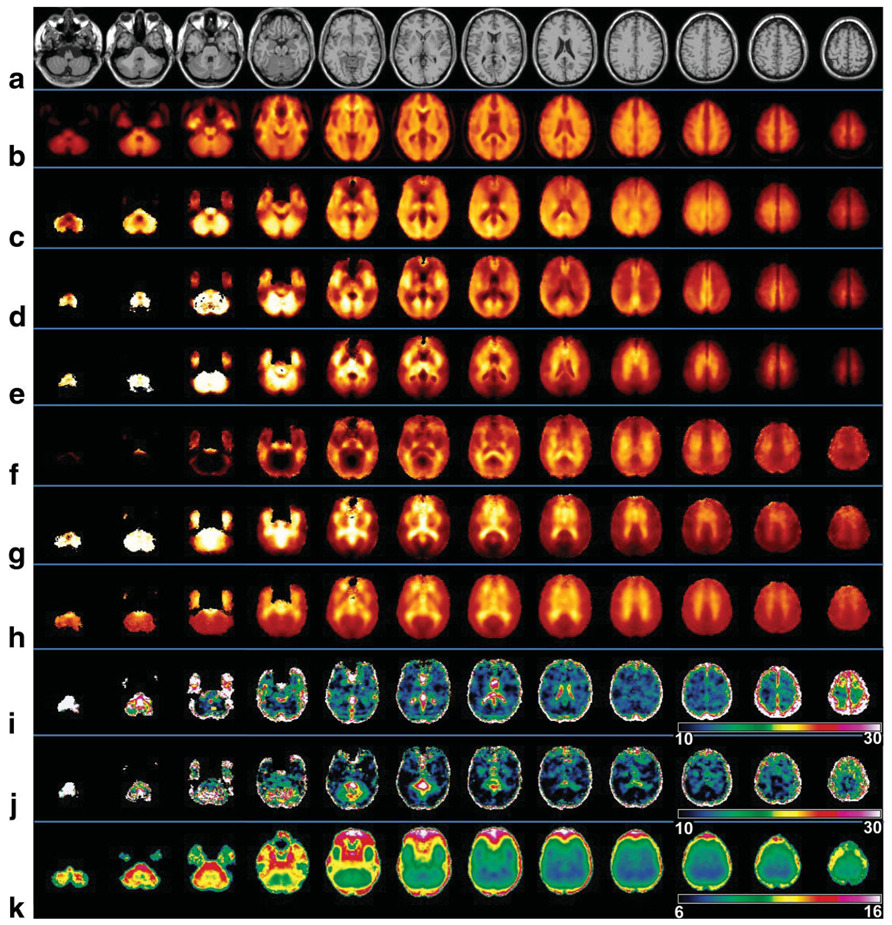
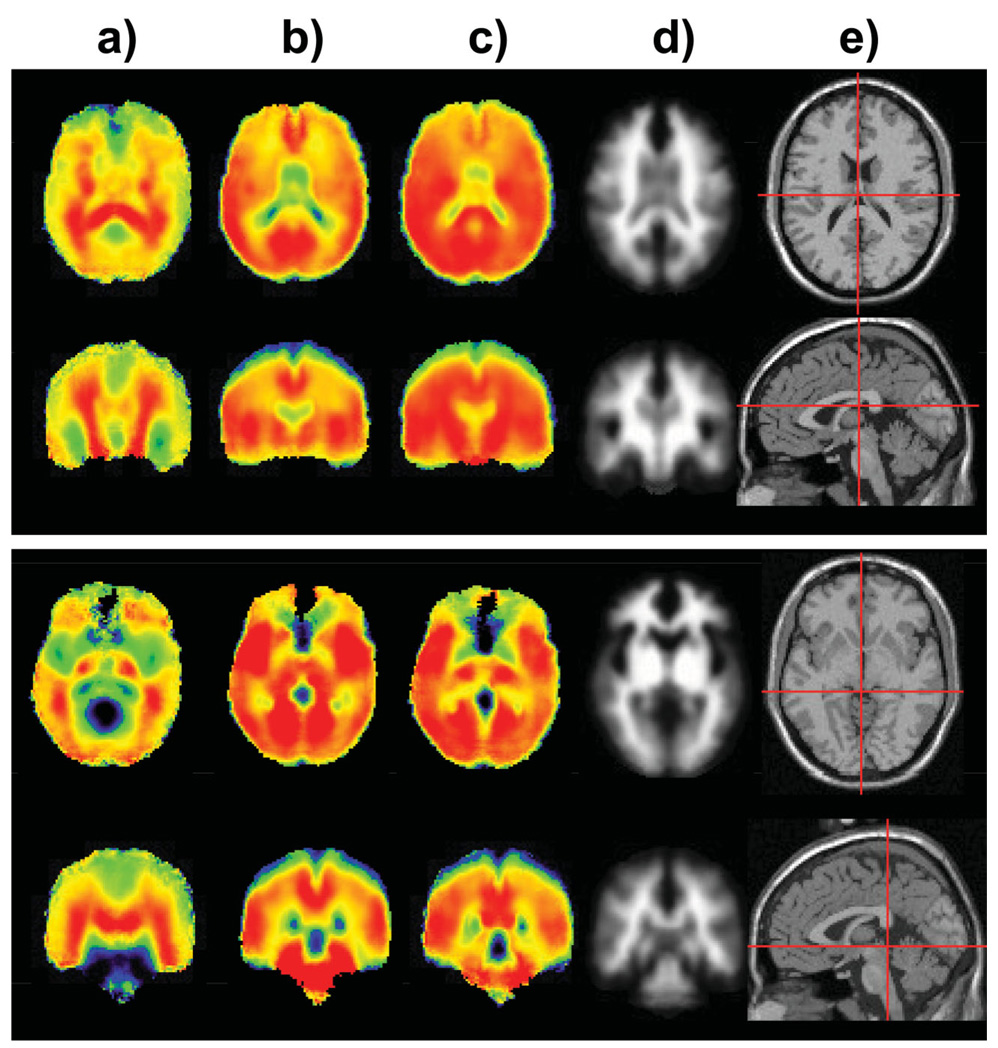
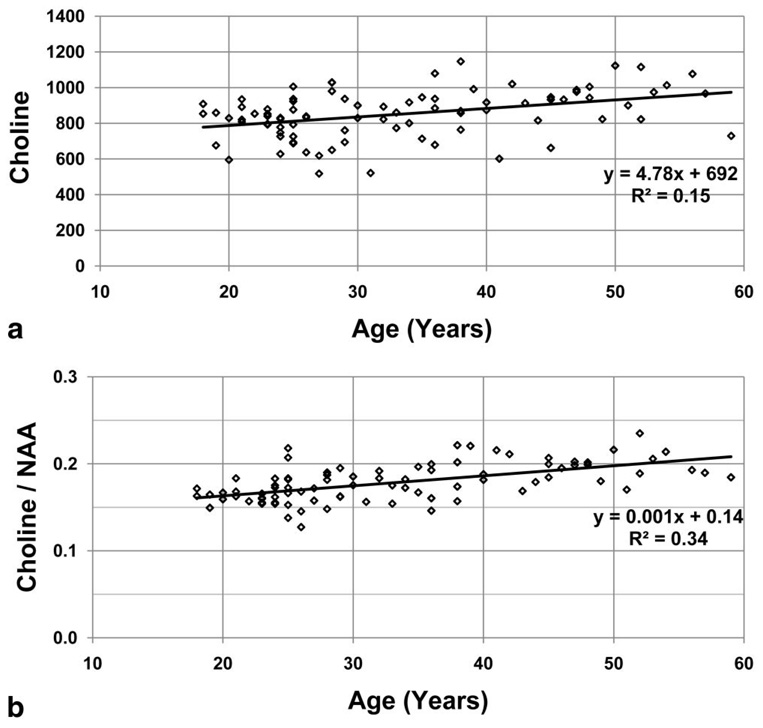
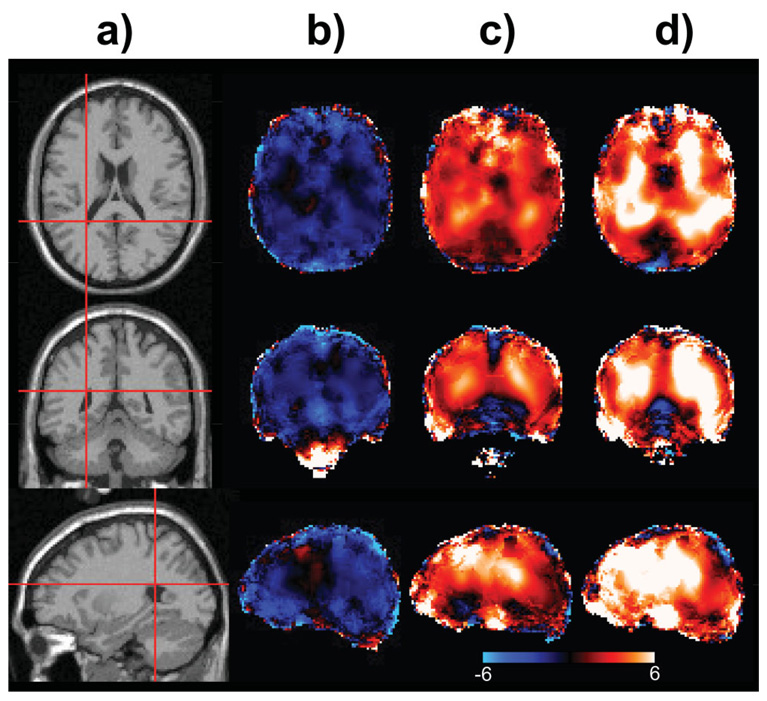
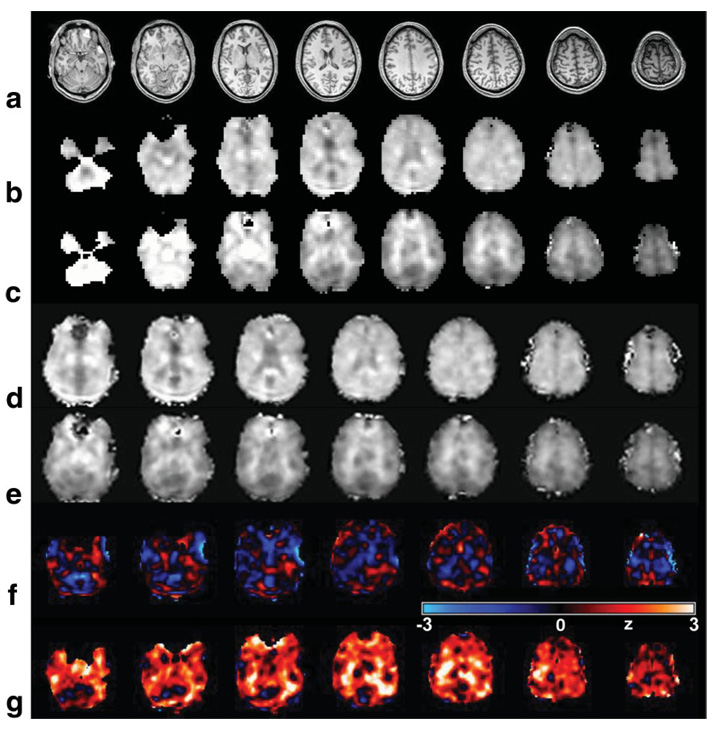
Distributions of proton MR-detected metabolites have been mapped throughout the brain in a group of normal subjects using a volumetric MR spectroscopic imaging (MRSI) acquisition with an interleaved water reference. Data were processed with intensity and spatial normalization to enable voxel-based analysis methods to be applied across a group of subjects. Results demonstrate significant regional, tissue, and gender-dependent variations of brain metabolite concentrations, and variations of these distributions with normal aging. The greatest alteration of metabolites with age was observed for white-matter choline and creatine. An example of the utility of the normative metabolic reference information is then demonstrated for analysis of data acquired from a subject who suffered a traumatic brain injury. This study demonstrates the ability to obtain proton spectra from a wide region of the brain and to apply fully automated processing methods. The resultant data provide a normative reference for subsequent utilization for studies of brain injury and disease.


Figures

FIG. 1
FIG. 1
Representative images and spectra for a single-subject study. The figure shows every second slice from the volumetric SI-resolution data for (a) NAA, (b) Cre, (c) Cho, (d) the water-reference, and (e) the WM segmentation at the MRSI spatial resolution. f,g: Example spectra for a typical narrow linewidth and at the broadest linewidth accepted for further analysis, obtained from the regions indicated by the triangle and circle, respectively.
FIG. 2
FIG. 2
Selected axial slices at 10-mm spacing following the voxel-based group analysis. Shown are (a) the spatial-reference MRI, (b) mean water-reference SI, (c) mean NAA, (d) mean Cre, (e) mean Cho, (f) NAA/Cre, (g) Cho/NAA, (h) Cho/Cre, (i) COV for NAA (%), (j) COV for NAA/Cre (%), and (k) mean linewidth (Hz). The images shown for i and j were obtained for the 18–30-year age group.
FIG. 3
FIG. 3
Selected axial and coronal sections of the mean images for (a) NAA/Cre, (b) Cre, (c) NAA, (d) WM, and (e) the reference MRI in axial and sagittal sections showing the slice selection.
FIG. 4
FIG. 4
Example results for the regression of the average frontal WM Cho in institutional units (a) and Cho/NAA ratio (b) as a function of the subject age. The linear regression equations are shown in the inset with their coefficient of determination, R2.
FIG. 5
FIG. 5
Selected slices showing the results of the image voxel-based age regression analysis. Shown are (a) the reference MRI, (b) NAA, (c) Cre, and (d) Cho. Images are shown in a dual color scale running from −6%/decade (blue) to +6%/decade (white).
FIG. 6
FIG. 6
Example metabolite image analysis based on comparison against normative values for a subject with a TBI. Shown are axial slices at 11-mm intervals from the T1 MRI (a) and metabolite images for NAA (b) and Cho (c) from the acquired study data. These same metabolite images are then shown following spatial transformation to the standard reference frame in d and e at a 10-mm slice interval. The corresponding z-score maps indicating the relative difference from the normal subject reference data are then shown for (f) NAA and (g) Cho. These last two images are shown in a color scale running from −3σ (blue) to +3σ (white).

References

    1. Chang L, Ernst T, Poland RE, Jenden DJ. In vivo proton magnetic resonance spectroscopy of the normal aging human brain. Life Sci. 1996;58:2049–2056. - PubMed
    1. McLean MA, Woermann FG, Barker GJ, Duncan JS. Quantitative analysis of short echo time 1H-MRSI of cerebral gray and white matter. Magn Reson Med. 2000;44:401–411. - PubMed
    1. Angelie E, Bonmartin A, Boudraa A, Gonnaud PM, Mallet JJ, Sappey-Marinier D. Regional differences and metabolic changes in normal aging of the human brain: proton MR spectroscopic imaging study. AJNR Am J Neuroradiol. 2001;22:119–127. - PMC - PubMed
    1. Harada M, Miyoshi H, Otsuka H, Nishitani H, Uno M. Multivariate analysis of regional metabolic differences in normal ageing on localised quantitative proton MR spectroscopy. Neuroradiology. 2001;43:448–452. - PubMed
    1. Schuff N, Ezekiel F, Gamst A, Amend D, Capizzano AA, Maudsley AA, Weiner MW. Region and tissue differences of metabolites in normally aged brain using 1H magnetic resonance spectroscopic imaging. Magn Reson Med. 2001;45:899–907. - PMC - PubMed

Publication types

MeSH terms