. 2009 Mar;296(3):L372-83.
doi: 10.1152/ajplung.90437.2008. Epub 2008 Dec 26.

SARS-CoV proteins decrease levels and activity of human ENaC via activation of distinct PKC isoforms

Affiliations

SARS-CoV proteins decrease levels and activity of human ENaC via activation of distinct PKC isoforms

Hong-Long Ji et al. Am J Physiol Lung Cell Mol Physiol. 2009 Mar.

Abstract

Among the multiple organ disorders caused by the severe acute respiratory syndrome coronavirus (SARS-CoV), acute lung failure following atypical pneumonia is the most serious and often fatal event. We hypothesized that two of the hydrophilic structural coronoviral proteins (S and E) would regulate alveolar fluid clearance by decreasing the cell surface expression and activity of amiloride-sensitive epithelial sodium (Na(+)) channels (ENaC), the rate-limiting protein in transepithelial Na(+) vectorial transport across distal lung epithelial cells. Coexpression of either S or E protein with human alpha-, beta-, and gamma-ENaC in Xenopus oocytes led to significant decreases of both amiloride-sensitive Na(+) currents and gamma-ENaC protein levels at their plasma membranes. S and E proteins decreased the rate of ENaC exocytosis and either had no effect (S) or decreased (E) rates of endocytosis. No direct interactions among SARS-CoV E protein with either alpha- or gamma-ENaC were indentified. Instead, the downregulation of ENaC activity by SARS proteins was partially or completely restored by administration of inhibitors of PKCalpha/beta1 and PKCzeta. Consistent with the whole cell data, expression of S and E proteins decreased ENaC single-channel activity in oocytes, and these effects were partially abrogated by PKCalpha/beta1 inhibitors. Finally, transfection of human airway epithelial (H441) cells with SARS E protein decreased whole cell amiloride-sensitive currents. These findings indicate that lung edema in SARS infection may be due at least in part to activation of PKC by SARS proteins, leading to decreasing levels and activity of ENaC at the apical surfaces of lung epithelial cells.


Figures

Fig. 1.
Fig. 1.
Coexpression of severe acute respiratory syndrome coronavirus (SARS-CoV) spike (S) and envelop (E) proteins reduce α,β,γ-epithelial Na+ channel (ENaC) activity in Xenopus oocytes. A: representative current traces recorded across Xenopus oocytes injected with α,β,γ-human ENaC (hENaC) cRNAs alone (top), α,β,γ-hENaC and SARS-CoV S protein (middle), and α,β,γ-hENaC and SARS-CoV E protein (bottom). Currents were measured following a change in the membrane potential from the holding potential (−40 mV) to −120 and +100 mV for 500 mS. After the inward and outward currents became stable, oocytes were perfused with 10 μM amiloride, as indicated. Amil, amiloride. B: amiloride-sensitive Na+ currents (IENaC) at −120 mV in oocytes expressing α,β,γ-hENaC alone (αβγ) or α,β,γ-ENaC and either SARS-CoV S protein (+S) or SARS-CoV E protein (+E). IENaC were calculated as described in materials and methods. Values are means ± SE; no. of oocytes is as follows: αβγ, n = 21; +S, n = 29; +E, n = 7. **P < 0.001 compared with the IENaC of αβγ alone. C: resting membrane potentials (in mV) were measured at the current-clamp mode for water (H2O)-injected oocytes and oocytes expressing α,β,γ-hENaC with or without SARS-CoV S or E protein. Bars represent means ± SE; no. of oocytes is as follows: H2O, n = 20; αβγ, n = 21; +S, n = 29; +E, n = 7. Normal resting membrane potential of uninjected oocytes is approximately −25 mV in ND-96 medium. **P < 0.001 for the indicated comparisons.
Fig. 2.
Fig. 2.
SARS-CoV proteins reduce total ENaC protein expression in oocytes. A: representative Western blots for α-hENaC (top) and γ-hENaC (bottom) from 4 similar experiments. Twenty oocytes each, expressing α,β,γ-hENaC with or without SARS-CoV S or E protein, were lysed, and proteins were separated with SDS-PAGE, transferred to nitrocellulose, and probed with anti-α- or anti-γ-ENaC antibodies as described in materials and methods. Equal amounts of proteins were loaded in each lane. B: densitometric analysis of Western blots. Values are means ± SE; no. of measurements is as follows: α-ENaC, n = 8 for each bar; γ-ENaC, n = 7 for each bar. **P < 0.001 compared with the corresponding αβγ value for each group.
Fig. 3.
Fig. 3.
SARS-CoV proteins decrease ENaC protein levels at the plasma membrane. A: biotinylated plasma membrane proteins were isolated as described in materials and methods and probed with an antibody to γ-hENaC. Representative Western blots for γ-ENaC are from 3 independent experiments. B: average density (means ± SE) of the γ-hENaC band. **P < 0.001 compared with αβγ alone. See Fig. 2 legend for details.
Fig. 4.
Fig. 4.
SARS-CoV proteins alter rates of ENaC exocytosis and endocytosis. A: ENaC exocytosis. IENaC of oocytes injected with α,β,γG536C-hENaC and incubated with methanethiosulfonate bromide (MTSET; 1 mM). The residual MTSET was washed out, and the recorded IENaC reflect newly synthesized ENaC proteins delivered to the plasma membrane. Values are means ± SE for the indicated time points; n = 5. B: ENaC endocytosis. IENaC were measured at time 0 and at 1 and 3 h following pretreatment of oocytes with 5 μM brefeldin A to disrupt delivery of newly synthesized ENaC to plasma membrane. Data are expressed as the ratio of amiloride-sensitive Na+ current at each indicated time point (IENaCt) divided by the corresponding value just before treatment with brefeldin (IENaC0). Data shown in A and B were fitted with linear regression; slopes indicate rates of ENaC exocytosis and endocytosis, respectively. Values are means ± SE for the indicated time points; n = 8. C and D: values are means ± SE of slopes (rates of exocytosis, n = 5; endocytosis, n = 8) shown in A and B, respectively. *P < 0.05 compared with αβγ alone.
Fig. 5.
Fig. 5.
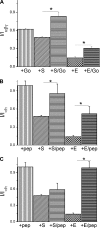
SARS-CoV E and S downregulation of ENaC are mediated by activation of isoforms of PKC. A: oocytes injected with α,β,γ-hENaC with or without SARS-CoV S or E protein were incubated 24 h later with the PKC inhibitor Gö-6976 (Go; 5 nM or an equal volume of DMSO, a solvent of Gö-6976) for 24 h in L-15 medium at 16°C, at which time currents were measured before and after the addition of amiloride (10 μM) and IENaC were calculated and expressed as the fraction of IENaC of oocytes expressing αβγ alone (I/Iαβγ). Values are means ± SE at −120 mV; n ≥ 12. *P < 0.05 for the indicated comparisons. B and C: effects of PKC specific isozyme 20-80 peptide (pep; B) and myristoylated PKCζ inhibitory peptide (pep; C) on SARS protein-mediated downregulation of ENaC. Values are means ± SE at −120 mV; n ≥ 12.*P < 0.05 for the indicated comparisons.
Fig. 6.
Fig. 6.
Expression of SARS proteins decreases single-channel ENaC activity. A: representative single-channel current traces digitized from cell-attached patches in oocytes expressing α,β,γ-hENaC with and without SARS-CoV S and E proteins. The patch potential was −80 mV. Dotted lines illustrate open (o) and closed levels (c). B: representative single-channel current traces obtained in oocytes pretreated with PKCα/β1 inhibitor Gö-6979 for 24 h. The scale bar for A is also applied to B. C: single-channel activity (NPo) of 5 oocytes shown in A and B. Values are means ± SE; n ≥ 12 for each group. *P < 0.001 compared with corresponding values of αβγ. #P < 0.05 compared with the corresponding value without Go.
Fig. 7.
Fig. 7.
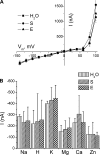
Cation permeabilities of SARS-CoV proteins heterologously expressed in Xenopus oocytes. A: proton (H+) permeability. Oocytes expressing either SARS-CoV S or E protein were perfused with acidic ND-96 (pH 6.0) containing amiloride (10 μM). Uninjected oocytes or H2O-injected oocytes served as controls. Currents (I) recorded from −140 to +100 mV in an increment of 20 mV were plotted as a function of membrane potential (Vm). B: cation permeability. Oocytes were perfused with Na+ (ND-96 at pH 7.5), K+ (Na+ was substituted with equal moles of K+), Mg2+ (ND-96 + 20 mM MgCl2), Ca2+ (ND-96 + 20 mM CaCl2), and Zn2+ (ND-96 + 1 mM ZnCl2). Average (±SE) currents at −120 mV from oocyte expressing SARS-CoV S and E protein were compared with those from H2O-injected oocytes (n = 6–10).
Fig. 8.
Fig. 8.
Expression of SARS-CoV E proteins in H441 cells. H441 cells were cultured on coverslips and transfected with a plasmid containing green fluorescence protein (GFP)-tagged SARS-CoV E protein at 80% confluence as described in materials and methods. Overlapping bright field and fluorescent images of H441 cells show nuclei stained with Hoechst 33258 and transfected cells (used for patch-clamp recordings) emitting green fluorescence.
Fig. 9.
Fig. 9.
Downregulation of native ENaC activity by SARS-CoV E protein in H441 cells. H441 cells were transfected with a plasmid expressing SARS-CoV E-GFP proteins as described in materials and methods. A: basal and amiloride-sensitive (INa) whole cell current densities of H441 cells expressing SARS-CoV E (+E; as indicated by the presence of green fluorescence; see Fig. 8) or control cells (H441) recorded at −100 mV. Values are means ± SE; n = 5 for control and 6 for SARS-CoV E-transfected cells. **P < 0.01, current densities in SARS-CoV E protein-transfected cells compared with those in GFP-negative cells (control). B: current-voltage curves of INa in control cells (▪) and SARS-CoV E protein-transfected cells (•). Whole cell conductances were computed as the slope of the curves by fitting the raw data with linear regression. Values are means ± SE; n = 5 for control and 6 for SARS-CoV E-transfected cells.
Fig. 10.
Fig. 10.
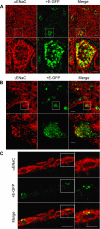
Confocal immunofluorescent imaging of ENaC and SARS-CoV E in H441 cells. H441 cells were cultured, transfected with GFP-tagged SARS-CoV E cDNA plasmid, and incubated with either anti-α-ENaC (A and C) or anti-γ-ENaC antibodies (B), followed by an AlexaFluor 594-conjugated secondary antibody 48 h later. Images were also taken in green channel to show cells expressing GFP-tagged SARS-CoV E protein. Bottom panels of A and B and right panels of C show higher magnification of the areas defined by the corresponding boxes. Merging of ENaC and SARS-CoV E images in either XY plane (A and B) or XZ plane (C) indicates little colocalization (yellow) of these 2 proteins. Scale bars in top panels of A and B and left panel of C represent 20 μm; scale bars in bottom panels of A and B and right panels of C represent 4 and 10 μm, respectively. Images are representative of 20 slides from 2 independent experiments.
Fig. 11.
Fig. 11.
Immunoprecipitation of α ENaC and SARS-CoV E proteins in α,β,γ-ENaC-expressing oocytes. A: detection of GFP-tagged SARS-CoV E and α-ENaC proteins expressed in oocytes. Oocytes were injected with GFP-tagged SARS-CoV E (E-GFP) and Flag-tagged α- and wild-type β,γ-hENaC cRNAs (ENaC) as indicated. Lysates were Western blotted with either anti-Flag (Flag-α-ENaC) or anti-GFP (E-GFP) antibodies to show expression of ENaC or SARS-CoV E protein. B: lysates from ENaC-expressing oocytes were immunoprecipitated (IP) with anti-GFP or anti-Flag antibodies in SDS-PAGE gel, and the blot was then probed with anti-Flag antibody (IB). C: oocytes lysates were immunoprecipitated with anti-Flag and anti-GFP antibodies, and then the blot was probed with anti-GFP antibody. No coimmunoprecipitation between ENaC and SARS-CoV E was seen in either case. Each experiment was repeated at least twice with the same results.

Similar articles

Cited by

References

    1. Awayda MS Specific and nonspecific effects of protein kinase C on the epithelial Na+ channel. J Gen Physiol 115: 559–570, 2000. - PMC - PubMed
    1. Awayda MS, Ismailov II, Berdiev BK, Fuller CM, Benos DJ. Protein kinase regulation of a cloned epithelial Na+ channel. J Gen Physiol 108: 49–65, 1996. - PMC - PubMed
    1. Burch LH, Talbot CR, Knowles MR, Canessa CM, Rossier BC, Boucher RC. Relative expression of the human epithelial Na+ channel subunits in normal and cystic fibrosis airways. Am J Physiol Cell Physiol 269: C511–C518, 1995. - PubMed
    1. Canessa CM, Schild L, Buell G, Thorens B, Gautschi I, Horisberger JD, Rossier BC. Amiloride-sensitive epithelial Na+ channel is made of three homologous subunits. Nature 367: 463–467, 1994. - PubMed
    1. Chen L, Song W, Davis IC, Shrestha K, Schwiebert E, Sullender WM, Matalon S. Inhibition of Na+ transport in lung epithelial cells by respiratory syncytial virus infection. Am J Respir Cell Mol Biol. In press. - PMC - PubMed

Publication types

MeSH terms

LinkOut - more resources