

Defining developmental potency and cell lineage trajectories by expression profiling of differentiating mouse embryonic stem cells
- PMID: 19112179
- PMCID: PMC2644347
- DOI: 10.1093/dnares/dsn035
Defining developmental potency and cell lineage trajectories by expression profiling of differentiating mouse embryonic stem cells
Abstract
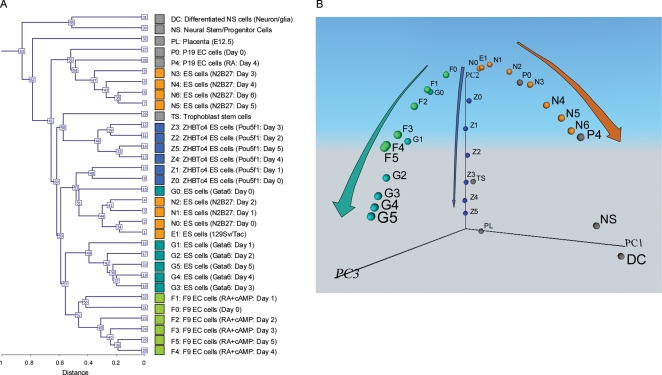
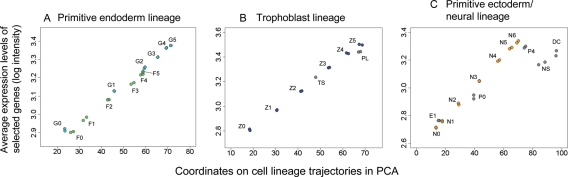
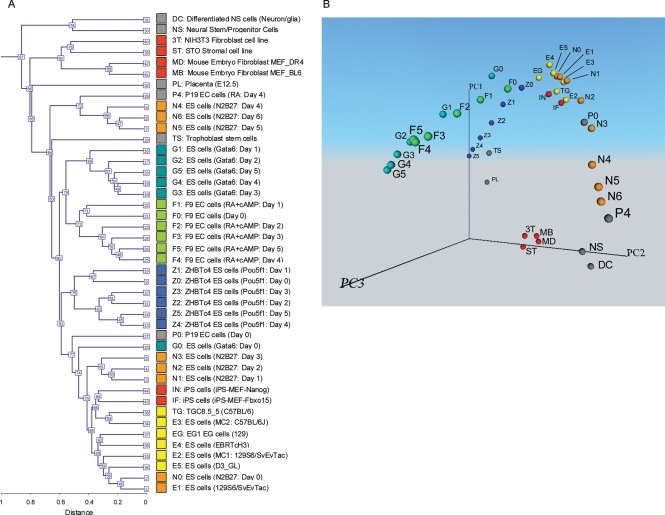
Biologists rely on morphology, function and specific markers to define the differentiation status of cells. Transcript profiling has expanded the repertoire of these markers by providing the snapshot of cellular status that reflects the activity of all genes. However, such data have been used only to assess relative similarities and differences of these cells. Here we show that principal component analysis of global gene expression profiles map cells in multidimensional transcript profile space and the positions of differentiating cells progress in a stepwise manner along trajectories starting from undifferentiated embryonic stem (ES) cells located in the apex. We present three 'cell lineage trajectories', which represent the differentiation of ES cells into the first three lineages in mammalian development: primitive endoderm, trophoblast and primitive ectoderm/neural ectoderm. The positions of the cells along these trajectories seem to reflect the developmental potency of cells and can be used as a scale for the potential of cells. Indeed, we show that embryonic germ cells and induced pluripotent cells are mapped near the origin of the trajectories, whereas mouse embryo fibroblast and fibroblast cell lines are mapped near the far end of the trajectories. We suggest that this method can be used as the non-operational semi-quantitative definition of cell differentiation status and developmental potency. Furthermore, the global expression profiles of cell lineages provide a framework for the future study of in vitro and in vivo cell differentiation.
Figures
References
-
- Waddington C. H. The Strategy of the Genes. London: George Allen & Unwin Ltd; 1957.
-
- Slack J. M. Conrad Hal Waddington: the last Renaissance biologist? Nat. Rev. Genet. 2002;3:889–895. - PubMed
-
- Campbell K. H., McWhir J., Ritchie W. A., Wilmut I. Sheep cloned by nuclear transfer from a cultured cell line. Nature. 1996;380:64–66. - PubMed
-
- Wakayama T., Perry A. C., Zuccotti M., Johnson K. R., Yanagimachi R. Full-term development of mice from enucleated oocytes injected with cumulus cell nuclei. Nature. 1998;394:369–374. - PubMed
Publication types
MeSH terms
Grants and funding
LinkOut - more resources
Full Text Sources
Other Literature Sources
Molecular Biology Databases
Miscellaneous
