. 2008 Dec;4(12):e1000251.
doi: 10.1371/journal.pcbi.1000251. Epub 2008 Dec 26.

The morphological identity of insect dendrites

Affiliations

The morphological identity of insect dendrites

Hermann Cuntz et al. PLoS Comput Biol. 2008 Dec.

Abstract

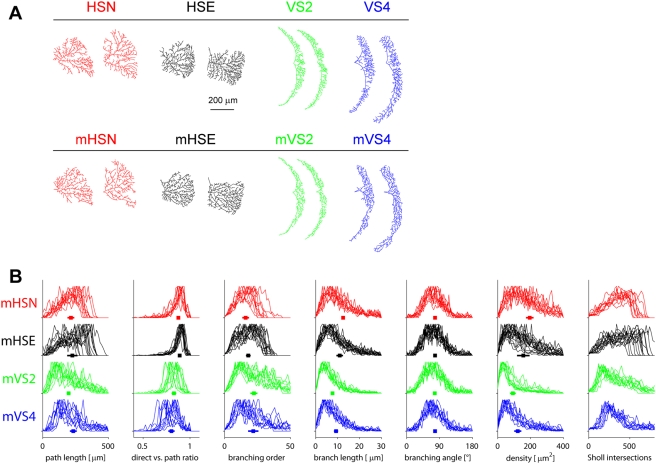
Dendrite morphology, a neuron's anatomical fingerprint, is a neuroscientist's asset in unveiling organizational principles in the brain. However, the genetic program encoding the morphological identity of a single dendrite remains a mystery. In order to obtain a formal understanding of dendritic branching, we studied distributions of morphological parameters in a group of four individually identifiable neurons of the fly visual system. We found that parameters relating to the branching topology were similar throughout all cells. Only parameters relating to the area covered by the dendrite were cell type specific. With these areas, artificial dendrites were grown based on optimization principles minimizing the amount of wiring and maximizing synaptic democracy. Although the same branching rule was used for all cells, this yielded dendritic structures virtually indistinguishable from their real counterparts. From these principles we derived a fully-automated model-based neuron reconstruction procedure validating the artificial branching rule. In conclusion, we suggest that the genetic program implementing neuronal branching could be constant in all cells whereas the one responsible for the dendrite spanning field should be cell specific.


Conflict of interest statement

The authors have declared that no competing interests exist.

Figures

Figure 1
Figure 1. Dendrite morphological statistics.
(A,B), Sketches showing HSE and HSN (A) and VS2 and VS4 (B) in the context of the lobula plate (gray). (C,D), Superimposed full anatomies of all individual cells sorted according to their respective cell type. Cells were aligned along their axonal axis (red lines). To the right, the corresponding dendrite spanning fields are outlined. (E–K) Statistics specifically related to dendrite branching. Statistics are represented as superimposed distribution histograms, filled squares show mean values and error bars correspond to standard deviation between individual dendrites: (E) path length to root values for all topological points; (F) ratios between direct and path distances from each topological point to the dendrite root; (G) topological point branching order values, a measure for the topological distance from the dendrite root; (H) length values of branch pieces between topological points; (I) branching angle values at all branching points between the two direct daughter branches within the plane in which they lay; (K) surface area values assigned to each topological point after Voronoi segmentation indicating topological point density and distribution homogeneity. (L) Sholl intersection plots: number of intersections of each tree with circles with increasing diameter. (M–R) Statistics describing the dendrite spanning field: (M) total surface value of spanning field; (N) percentage of the spanning field below the axonal axis; (O) convexity index of the spanning field; (P) ratio of width against height of the spanning field; (Q and R) horizontal and vertical coordinates of centre of mass of the dendrite spanning field.
Figure 2
Figure 2. Cluster analysis.
(A) Dendrite spanning fields are readily separable into the individual cell types at the example here of two parameters only: the convexity and the relative location to the axonal axis (B) Cluster analysis using three parameters of a generalized extreme value distribution fits for branching properties from Figure 1E, 1G, and 1K.
Figure 3
Figure 3. Artificial dendrites grown in real dendrite spanning fields.
(A) Artificial dendrites: two examples of each cell type. Upper row: real dendrites. Lower row, marked by preceding “m”: artificial dendrites corresponding to each of the spanning field. (B) Artificial dendrite parameter distributions as in Figure 1E–K showing the similarity to their real counterparts.
Figure 4
Figure 4. Model-based reconstruction of neuronal branching from 3D two-photon image stacks.
Depicted at the example of an HSE dendrite (A,B) and of a VS2 cell (C,D). Left, maximum intensity projections of the image stacks containing fluorescent cells. Right, overlaid reconstructed branching in red.

References

    1. Stuart G, Spruston N, Häusser M. Dendrites. Oxford, UK: Oxford University Press; 2008.
    1. Euler T, Denk W. Dendritic processing. Curr Opin Neurobiol. 2001;11:415–422. - PubMed
    1. Koch C, Segev I. The role of single neurons in information processing. Nat Neurosci. 2000;3(Suppl):1171–1177. - PubMed
    1. Yuste R, Tank DW. Dendritic integration in mammalian neurons, a century after Cajal. Neuron. 1996;16:701–716. - PubMed
    1. Miller JP, Jacobs GA. Relationships between neuronal structure and function. J Exp Biol. 1984;112:129–145. - PubMed

Publication types