

Exploring the molecular design of protein interaction sites with molecular dynamics simulations and free energy calculations
- PMID: 19113835
- PMCID: PMC2754190
- DOI: 10.1021/bi8017043
Exploring the molecular design of protein interaction sites with molecular dynamics simulations and free energy calculations
Abstract
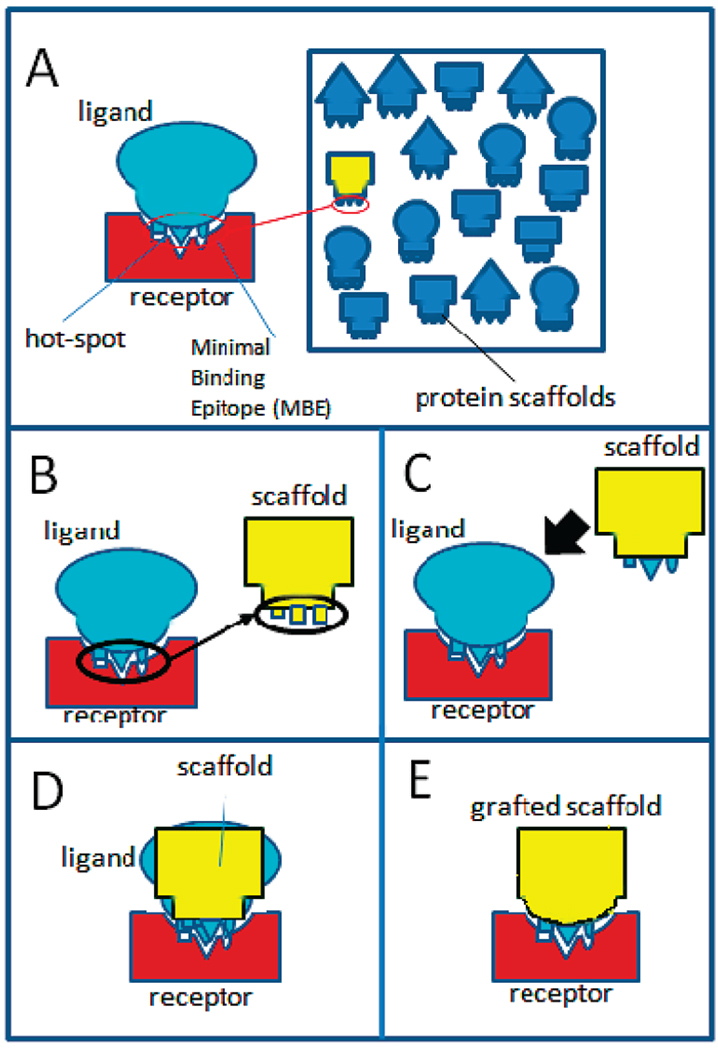
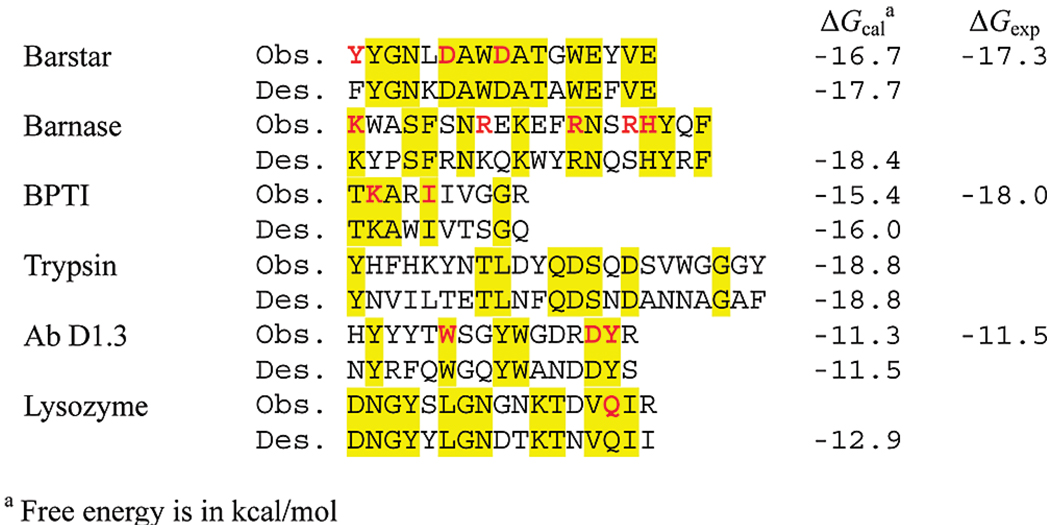
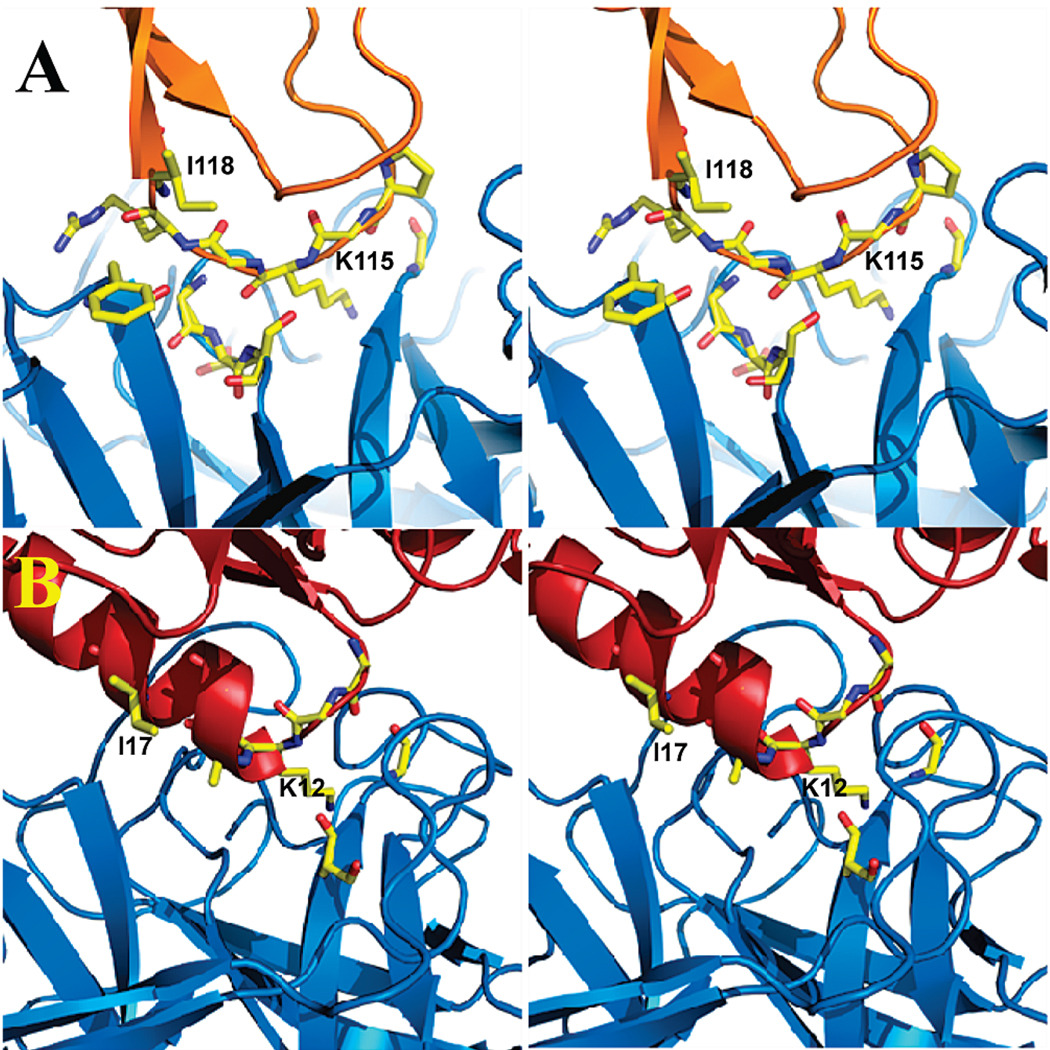
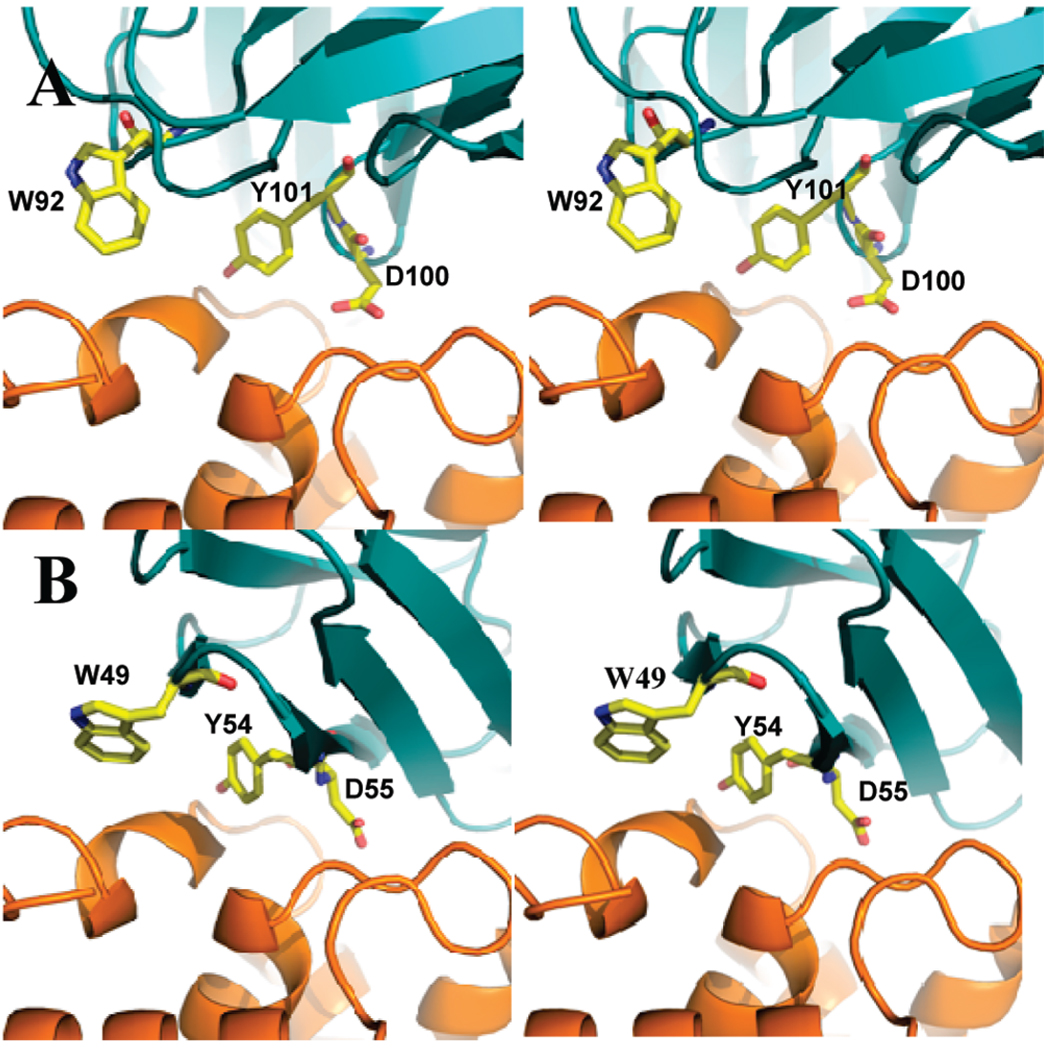
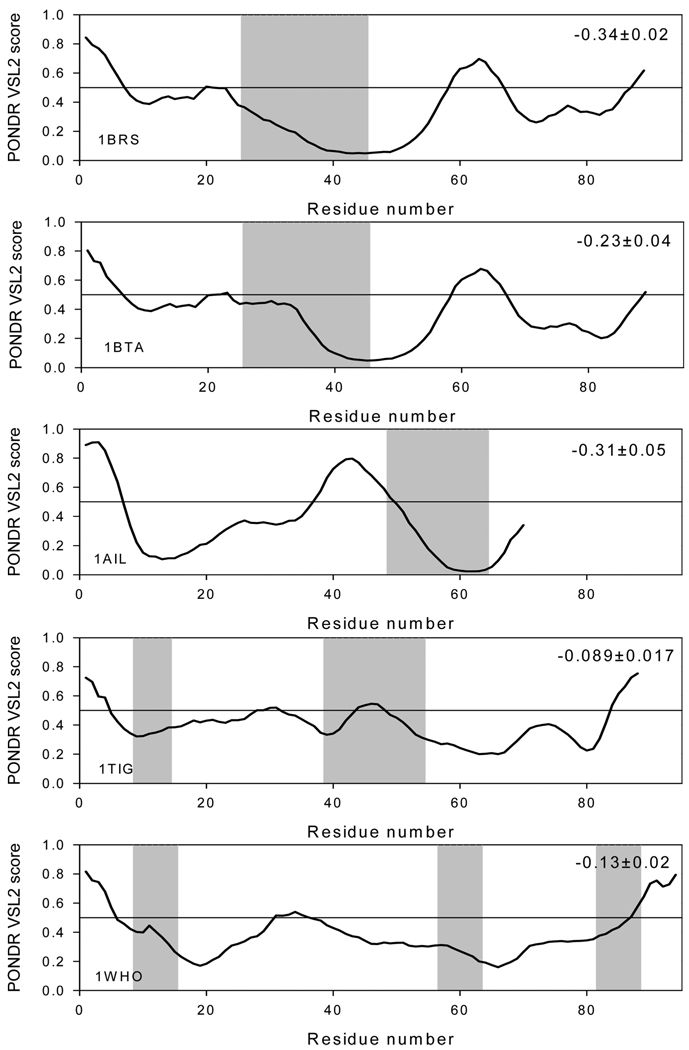
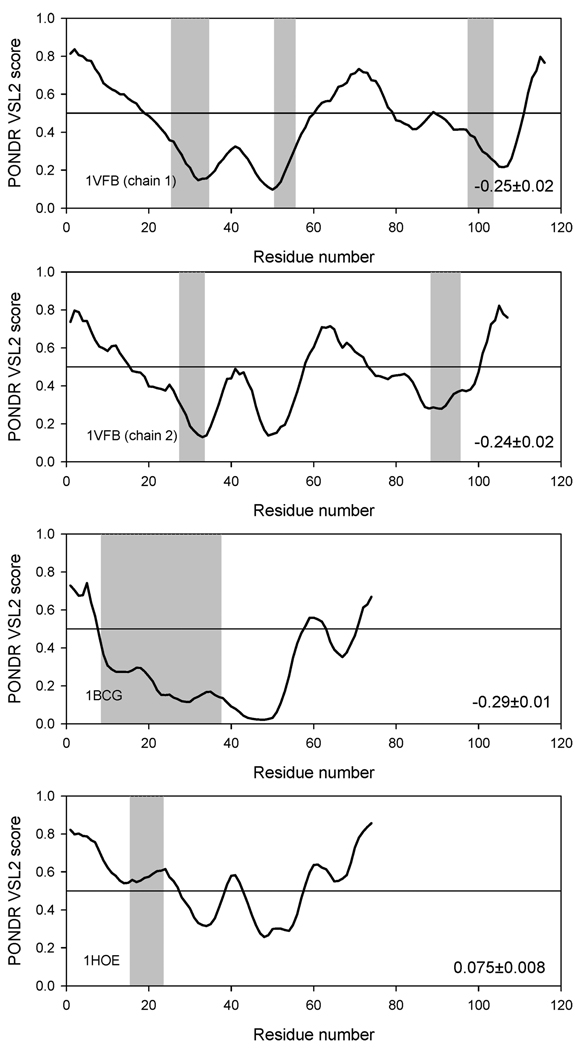
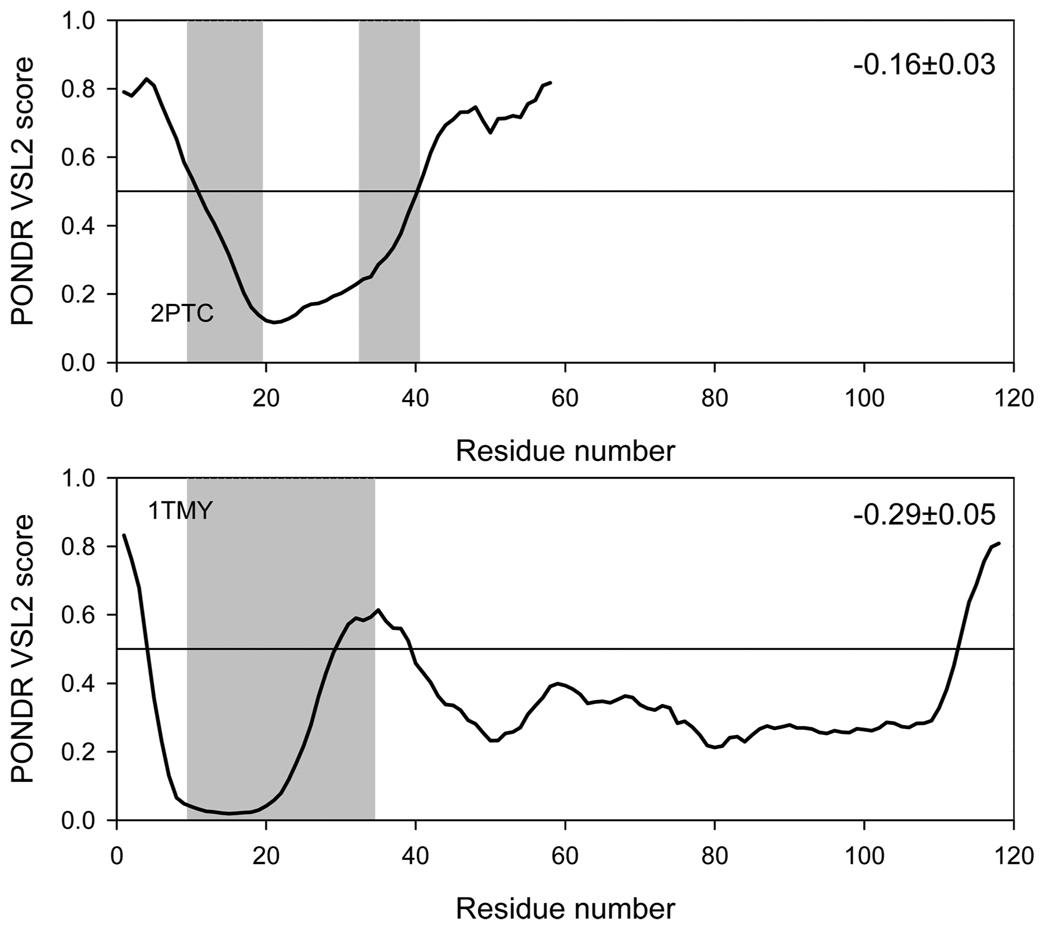
The significant work that has been invested toward understanding protein-protein interaction has not translated into significant advances in structure-based predictions. In particular redesigning protein surfaces to bind to unrelated receptors remains a challenge, partly due to receptor flexibility, which is often neglected in these efforts. In this work, we computationally graft the binding epitope of various small proteins obtained from the RCSB database to bind to barnase, lysozyme, and trypsin using a previously derived and validated algorithm. In an effort to probe the protein complexes in a realistic environment, all native and designer complexes were subjected to a total of nearly 400 ns of explicit-solvent molecular dynamics (MD) simulation. The MD data led to an unexpected observation: some of the designer complexes were highly unstable and decomposed during the trajectories. In contrast, the native and a number of designer complexes remained consistently stable. The unstable conformers provided us with a unique opportunity to define the structural and energetic factors that lead to unproductive protein-protein complexes. To that end we used free energy calculations following the MM-PBSA approach to determine the role of nonpolar effects, electrostatics and entropy in binding. Remarkably, we found that a majority of unstable complexes exhibited more favorable electrostatics than native or stable designer complexes, suggesting that favorable electrostatic interactions are not prerequisite for complex formation between proteins. However, nonpolar effects remained consistently more favorable in native and stable designer complexes reinforcing the importance of hydrophobic effects in protein-protein binding. While entropy systematically opposed binding in all cases, there was no observed trend in the entropy difference between native and designer complexes. A series of alanine scanning mutations of hot-spot residues at the interface of native and designer complexes showed less than optimal contacts of hot-spot residues with their surroundings in the unstable conformers, resulting in more favorable entropy for these complexes. Finally, disorder predictions revealed that secondary structures at the interface of unstable complexes exhibited greater disorder than the stable complexes.
Figures
Similar articles
-
Incorporating receptor flexibility in the molecular design of protein interfaces.Protein Eng Des Sel. 2009 Sep;22(9):575-86. doi: 10.1093/protein/gzp042. Epub 2009 Jul 30. Protein Eng Des Sel. 2009. PMID: 19643976
-
Molecular recognition in a diverse set of protein-ligand interactions studied with molecular dynamics simulations and end-point free energy calculations.J Chem Inf Model. 2013 Oct 28;53(10):2659-70. doi: 10.1021/ci400312v. Epub 2013 Oct 8. J Chem Inf Model. 2013. PMID: 24032517 Free PMC article.
-
Molecular dynamic simulation of wild type and mutants of the polymorphic amyloid NNQNTF segments of elk prion: structural stability and thermodynamic of association.Biopolymers. 2011 Sep;95(9):573-90. doi: 10.1002/bip.21611. Epub 2011 Mar 7. Biopolymers. 2011. PMID: 21384336
-
Structure, dynamics and interaction with kinase targets: computer simulations of calmodulin.Biochim Biophys Acta. 2004 Mar 11;1697(1-2):289-300. doi: 10.1016/j.bbapap.2003.11.032. Biochim Biophys Acta. 2004. PMID: 15023369 Review.
-
Prediction of the binding energy for small molecules, peptides and proteins.J Mol Recognit. 1999 May-Jun;12(3):177-90. doi: 10.1002/(SICI)1099-1352(199905/06)12:3<177::AID-JMR451>3.0.CO;2-Z. J Mol Recognit. 1999. PMID: 10398408 Review.
Cited by
-
Unraveling modulation effects on albumin synthesis and inflammation by Striatin, a bioactive protein fraction isolated from Channa striata: In silico proteomics and in vitro approaches.Heliyon. 2024 Sep 24;10(19):e38386. doi: 10.1016/j.heliyon.2024.e38386. eCollection 2024 Oct 15. Heliyon. 2024. PMID: 39398063 Free PMC article.
-
Multifarious roles of intrinsic disorder in proteins illustrate its broad impact on plant biology.Plant Cell. 2013 Jan;25(1):38-55. doi: 10.1105/tpc.112.106062. Epub 2013 Jan 29. Plant Cell. 2013. PMID: 23362206 Free PMC article. Review.
-
Disorder predictors also predict backbone dynamics for a family of disordered proteins.PLoS One. 2011;6(12):e29207. doi: 10.1371/journal.pone.0029207. Epub 2011 Dec 15. PLoS One. 2011. PMID: 22195023 Free PMC article.
-
BioDrugScreen: a computational drug design resource for ranking molecules docked to the human proteome.Nucleic Acids Res. 2010 Jan;38(Database issue):D765-73. doi: 10.1093/nar/gkp852. Epub 2009 Nov 18. Nucleic Acids Res. 2010. PMID: 19923229 Free PMC article.
-
RosettaBackrub--a web server for flexible backbone protein structure modeling and design.Nucleic Acids Res. 2010 Jul;38(Web Server issue):W569-75. doi: 10.1093/nar/gkq369. Epub 2010 May 12. Nucleic Acids Res. 2010. PMID: 20462859 Free PMC article.
References
-
- Archakov AI, Govorun VM, Dubanov AV, Ivanov YD, Veselovsky AV, Lewi P, Janssen P. Protein-protein interactions as a target for drugs in proteomics. Proteomics. 2003;3:380–391. - PubMed
-
- Keskin Z, Gursoy A, Ma B, Nussinov R. Principles of protein-protein interactions: What are the preferred ways for proteins to interact? Chem. Rev. 2008;108:1225–1244. - PubMed
-
- Reichmann D, Rahat O, Cohen M, Neuvirth H, Schreiber G. The molecular architecture of protein-protein binding sites. Curr. Opin. Struct. Biol. 2007;17:67–76. - PubMed
Publication types
MeSH terms
Substances
Associated data
- Actions
- Actions
- Actions
- Actions
- Actions
- Actions
- Actions
- Actions
- Actions
- Actions
- Actions
- Actions
- Actions
- Actions
- Actions
- Actions
- Actions
- Actions
- Actions
- Actions
- Actions
- Actions
- Actions
- Actions
- Actions
- Actions
- Actions
- Actions
- Actions
- Actions
- Actions
- Actions
- Actions
Grants and funding
LinkOut - more resources
Full Text Sources
Miscellaneous
