. 2009 Jun;24(6):1033-42.
doi: 10.1359/jbmr.081255.

Bone structure at the distal radius during adolescent growth

Affiliations

Bone structure at the distal radius during adolescent growth

Salman Kirmani et al. J Bone Miner Res. 2009 Jun.

Abstract

The incidence of distal forearm fractures peaks during the adolescent growth spurt, but the structural basis for this is unclear. Thus, we studied healthy 6- to 21-yr-old girls (n = 66) and boys (n = 61) using high-resolution pQCT (voxel size, 82 microm) at the distal radius. Subjects were classified into five groups by bone-age: group I (prepuberty, 6-8 yr), group II (early puberty, 9-11 yr), group III (midpuberty, 12-14 yr), group IV (late puberty, 15-17 yr), and group V (postpuberty, 18-21 yr). Compared with group I, trabecular parameters (bone volume fraction, trabecular number, and thickness) did not change in girls but increased in boys from late puberty onward. Cortical thickness and density decreased from pre- to midpuberty in girls but were unchanged in boys, before rising to higher levels at the end of puberty in both sexes. Total bone strength, assessed using microfinite element models, increased linearly across bone age groups in both sexes, with boys showing greater bone strength than girls after midpuberty. The proportion of load borne by cortical bone, and the ratio of cortical to trabecular bone volume, decreased transiently during mid- to late puberty in both sexes, with apparent cortical porosity peaking during this time. This mirrors the incidence of distal forearm fractures in prior studies. We conclude that regional deficits in cortical bone may underlie the adolescent peak in forearm fractures. Whether these deficits are more severe in children who sustain forearm fractures or persist into later life warrants further study.


Figures

FIG. 1
FIG. 1
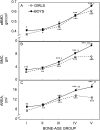
Trabecular and cortical bone parameters in bone-age groups I through V. (A) BV/TV, bone volume/total volume; (B) Tb.N, trabecular number; (C) Tb.Th, trabecular thickness; (D) Tb.Sp, trabecular spacing; (E) Ct.Th, cortical thickness; (F) cortical vBMD; (G) periosteal circumference; (H) endosteal circumference. *p < 0.05, **p < 0.01, and ***p < 0.001 vs. group I; p < 0.05, †† p < 0.01, and ††† p < 0.001 for comparison with the respective group of girls.
FIG. 2
FIG. 2
DXA parameters at the radius in bone-age groups I through V. (A) aBMD, (B) BMC, and (C) bone area. *p < 0.05, **p < 0.01, and ***p < 0.001 vs. group I; p < 0.05, †† p < 0.01, and ††† p < 0.001 for comparison with the respective group of girls.
FIG. 3
FIG. 3
(A and B) Total bone strength; (C and D) estimated fall loads; (E and F) factor of risk (Φ, ratio of fall loads to bone strength); (G and H) percent of load carried by cortical bone; and (I and J) ratio of cortical to trabecular bone volume in girls (left column) and boys (right column). Shaded regions represent the approximate chronological age ranges when the incidence of adolescent forearm fractures peaks based on previous data from Rochester, MN,(5) and elsewhere.(–3) *p < 0.05, **p < 0.01, and ***p < 0.001 vs. group I; p < 0.05, †† p < 0.01, and ††† p < 0.001 for comparison with the respective group of girls.
FIG. 4
FIG. 4
Cortical porosity index in girls (A) and boys (B). Shaded regions represent the approximate chronological age ranges when the incidence of adolescent forearm fractures peaks based on previous data from Rochester, MN,(5) and elsewhere.(–3) ***p < 0.001 vs. group I; †† p < 0.01 and ††† p < 0.001 for comparison with the respective group of girls.
FIG. 5
FIG. 5
Representative 3D reconstructions of trabecular and cortical bone of the measured region of the ultradistal radius in girls and boys from bone-age groups I, III, and V. The color coding is for the strain energy density (SED) from the μFE models, with low SED values indicating low strains (relatively strong areas) and high SED values indicating high strains (relatively weak areas). Note the thinning of the cortex (indicated by arrows) relative to the amount of trabecular bone present in the subjects in group III.
FIG. 6
FIG. 6
Representative 3D reconstructions of cortical bone and the very proximal trabecular bone in girls and boys from bone-age groups I, III, and V. The areas in red indicate cortical pores used to calculate the cortical porosity index.

References

    1. Landin LA. Fracture patterns in children. Acta Orthop Scand. 1983;54(Suppl 202):1–109. - PubMed
    1. Kramhoft M, Bodtker S. Epidemiology of distal forearm fractures in Danish children. Acta Orthop Scand. 1988;59:557–559. - PubMed
    1. Bailey DA, Wedge JH, McCulloch RG, Martin AD, Bernhardson SC. Epidemiology of fractures of the distal end of the radius in children as associated with growth. J Bone Joint Surg Am. 1989;71:1225–1231. - PubMed
    1. Tinkle BT, Wenstrup RJ. A genetic approach to fracture epidemiology in childhood. Am J Med Genet C Semin Med Genet. 2005;139:38–54. - PubMed
    1. Khosla S, Melton LJ, III, Dekutoski MB, Achenbach SJ, Oberg AL, Riggs BL. Incidence of childhood distal forearm fractures over 30 years: A population-based study. JAMA. 2003;290:1479–1485. - PubMed

Publication types