. 2009 Mar;191(5):1695-702.
doi: 10.1128/JB.01536-08. Epub 2008 Dec 29.

Growth phase- and cell division-dependent activation and inactivation of the {sigma}32 regulon in Escherichia coli

Affiliations

Growth phase- and cell division-dependent activation and inactivation of the {sigma}32 regulon in Escherichia coli

Maria Anna Wagner et al. J Bacteriol. 2009 Mar.

Abstract

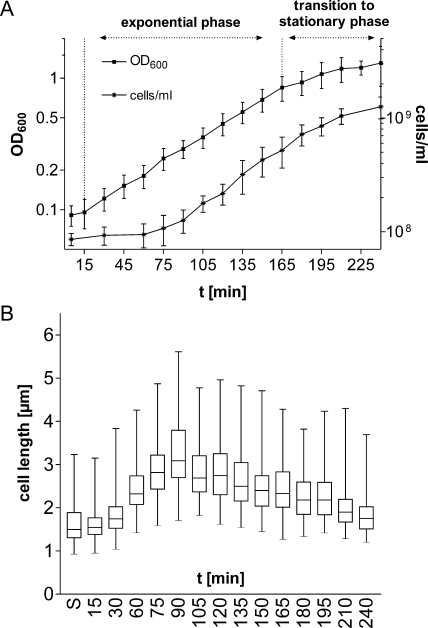
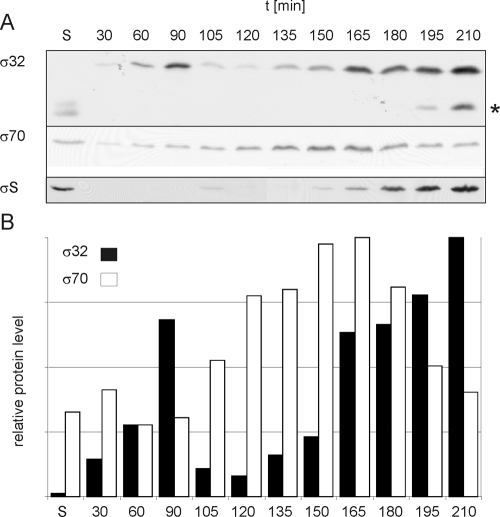
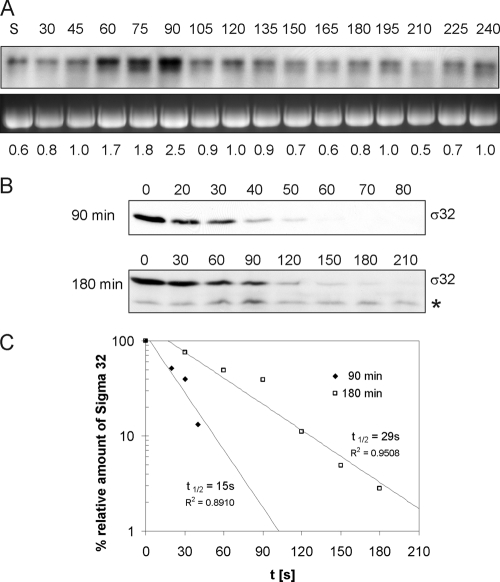
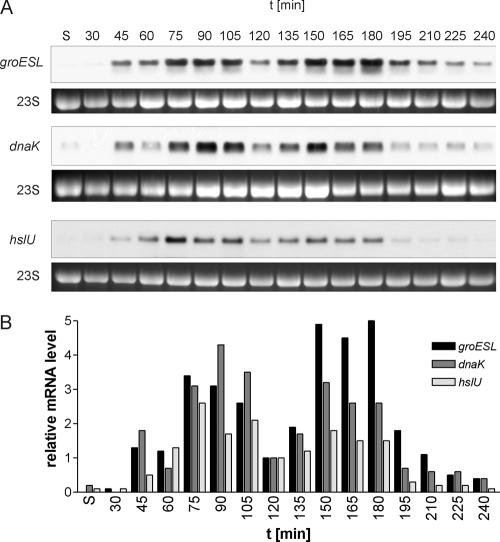
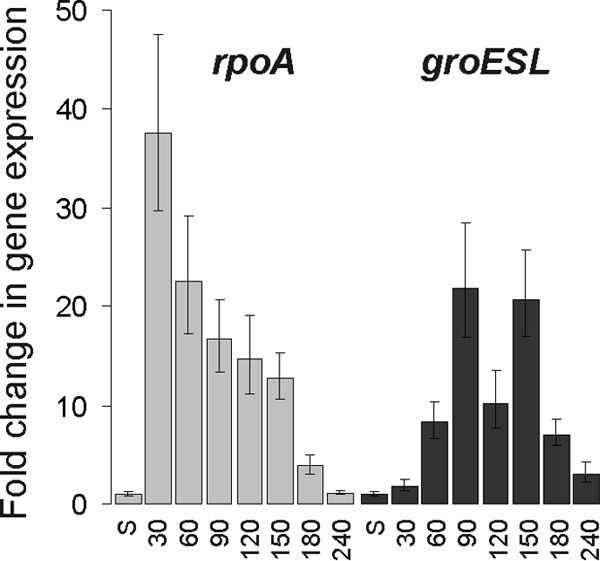
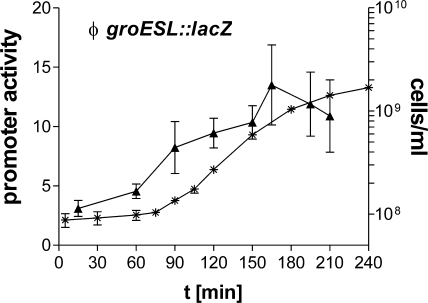
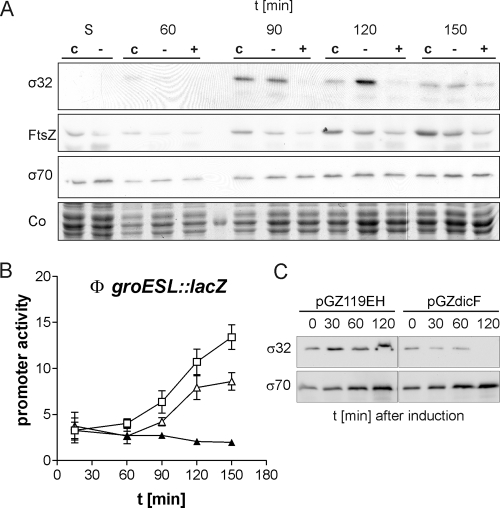
Alternative sigma factors allow bacteria to reprogram global transcription rapidly and to adapt to changes in the environment. Here we report on growth- and cell division-dependent sigma(32) regulon activity in Escherichia coli in batch culture. By analyzing sigma(32) expression in growing cells, an increase in sigma(32) protein levels is observed during the first round of cell division after exit from stationary phase. Increased sigma(32) protein levels result from transcriptional activation of the rpoH gene. After the first round of bulk cell division, rpoH transcript levels and sigma(32) protein levels decrease again. The late-logarithmic phase and the transition to stationary phase are accompanied by a second increase in sigma(32) levels and enhanced stability of sigma(32) protein but not by enhanced transcription of rpoH. Throughout growth, sigma(32) target genes show expression patterns consistent with oscillating sigma(32) protein levels. However, during the transition to early-stationary phase, despite high sigma(32) protein levels, the transcription of sigma(32) target genes is downregulated, suggesting functional inactivation of sigma(32). It is deduced from these data that there may be a link between sigma(32) regulon activity and cell division events. Further support for this hypothesis is provided by the observation that in cells in which FtsZ is depleted, sigma(32) regulon activation is suppressed.


Figures

FIG. 1.
FIG. 1.
Growth characteristics of a batch culture of E. coli MG1655. Late-stationary-phase cells grown in M9 minimal medium at 37°C for at least 20 h were taken and inoculated into fresh, prewarmed M9 medium. (A) Growth curves showing increases in cell mass (OD600) and in cell numbers (cells/ml) as determined by counting cells in a cell counter. Data shown are averages for at least three independent experiments. (B) Box-and-whisker plot representing cell length distributions. Cell lengths were determined by morphometric analyses of phase-contrast microscopic images. At least 150 cells were measured per time point. Boxes represent the cell length distribution of 50% of all measured cells; horizontal lines within boxes represent median cell lengths. After a short lag phase of approximately 15 min, cells start to grow and elongate. Cell lengths reach a maximum at 90 min, reflecting the time point before the majority of the cells divide for the first time (between 90 and 105 min). The 165-min time point marks the end of exponential growth and the beginning of the transition to stationary phase. S, stationary phase.
FIG. 2.
FIG. 2.
σ32, σ70, and σS protein levels during a growth cycle of E. coli MG1655 in M9 medium. (A) Cells were harvested at the indicated time points, and whole-cell lysates corresponding to 0.2 OD600 unit (∼3 × 10⁸ cells) were subjected to SDS-polyacrylamide gel electrophoresis and Western blotting with antibodies specific for σ32, σ70, or σS. Increased amounts of σ32 are detectable at 60 to 90 min and again at 165 min and later. σ70 protein levels show a distinctly different pattern, remaining similar throughout the growth cycle. The appearance of σS correlates with the transition to stationary phase and reaches a maximum at 195 min. (B) For quantification, Western blot signals were normalized to the amount of protein loaded. Bars represent the relative abundances of σ32 and σ70. S, stationary phase.
FIG. 3.
FIG. 3.
(A) rpoH mRNA levels. Total RNA was isolated from E. coli MG1655 at the indicated time points (in minutes) during a growth cycle, and Northern blot analysis was performed. Analysis of 23S rRNA, used as a loading control, is shown in the lower panel. For quantification, rpoH signals were normalized to the amount of RNA loaded. Numbers at the bottom represent the rpoH mRNA level at each time point relative to the level at 120 min. S, stationary phase. (B and C) σ32 protein stability. (B) σ32 degradation after inhibition of protein synthesis. Aliquots from 90- and 180-min cultures were taken at the indicated time points (seconds) after inhibition of protein synthesis. σ32 was detected by Western blotting. A star (*) marks the stable degradation product of σ32. (C) Amounts of σ32 plotted versus time. Values were used to determine the half-lives (t1/2) of σ32 in cells from 90-min and 180-min cultures.
FIG. 4.
FIG. 4.
Growth cycle-dependent oscillation of mRNA levels of σ32-controlled genes in E. coli MG1655. (A) Total RNA was isolated at the given time points and analyzed by Northern blotting. groESL, dnaK, and hslU mRNAs show similar fluctuation patterns during the course of the growth experiment. Transcript levels are low or below the detection limit in stationary phase, and an increase in the abundance of each transcript can be observed at 45 min, with a first peak at 75 to 90 min. After a decline with a minimum at 120 min, concomitant with the completion of the first round of cell division by most cells in the culture, a second peak appears at 150 min. The transition to stationary phase and the following reduction in cell division activity are accompanied by a marked reduction in transcript levels. 23S rRNA from the ethidium bromide-stained agarose gel is shown as a loading control. (B) Graphical representation of quantitated mRNA levels, showing the oscillation of the levels of σ32-dependent transcripts. The level of each mRNA at 120 min was set to 1. Experiments performed at least in triplicate produced similar results; one representative result is shown. S, stationary phase.
FIG. 5.
FIG. 5.
q-RT-PCR analysis of mRNA levels of σ70- and σ32-regulated genes in E. coli MG1655 shows that the observed oscillation pattern is specific for σ32-regulated genes. Total RNA was isolated at the time points shown. q-RT-PCR was performed, and the change in gene expression relative to that in stationary phase was calculated. The expression levels of rpoA70 dependent) and groESL32 dependent) mRNAs were distinctly different. A nutritional upshift caused an upregulation of rpoA expression (30 min, compared to stationary phase) whereas groESL expression was not affected by a nutritional upshift but oscillated in a pattern that correlated with cell division events. S, stationary phase.
FIG. 6.
FIG. 6.
Transcriptional activation of the σ32-controlled groESL promoter. Expression from the groESL promoter was determined using the E. coli groESL::lacZ reporter strain SR6618 and β-galactosidase assays. A significant increase in β-galactosidase levels (▴) (P < 0.05) was observed between 60 and 90 min. Cell division was monitored by determination of cell counts (*) (cells/ml). Promoter activity is given as ΔmOD420/min/OD600. Means and standard deviations for three independent experiments, with each sample measured in duplicate, are plotted.
FIG. 7.
FIG. 7.
Inhibition of an early step in cell division abolishes the σ32-dependent stress response in E. coli. (A) Steady-state levels of σ32, FtsZ, and σ70 proteins in cells expressing DicF antisense RNA (+) and in control cells with the vector (c) or the uninduced plasmid (−) were compared by Western blotting. As a loading control, a section of the Coomassie-stained gel (Co) is shown. (B) The activities of the σ32-dependent groESL promoter in SR6618 expressing DicF from plasmid pGZdicF to deplete FtsZ, compared to those in controls, are shown. ▴, pGZdicF induced with 70 μM IPTG; ▵, pGZdicF without IPTG; □, pGZ119EH (vector control) with 70 μM IPTG. (C) Inhibition of σ32 by DicF expression in asynchronously growing cells. MG1665 harboring pGZdicF or pGZ119EH (control) was inoculated to an OD600 of 0.01 and grown to early-logarithmic phase (OD600, ∼0.1). IPTG was added to induce DicF expression, and samples taken before (0) and after the addition of IPTG were analyzed by Western blotting.

References

    1. Avedissian, M., and S. Lopes Gomes. 1996. Expression of the groESL operon is cell-cycle controlled in Caulobacter crescentus. Mol. Microbiol. 1979-89. - PubMed
    1. Bi, E. F., and J. Lutkenhaus. 1991. FtsZ ring structure associated with division in Escherichia coli. Nature 354161-164. - PubMed
    1. Blattner, F. R., G. Plunkett III, C. A. Bloch, N. T. Perna, V. Burland, M. Riley, J. Collado-Vides, J. D. Glasner, C. K. Rode, G. F. Mayhew, J. Gregor, N. W. Davis, H. A. Kirkpatrick, M. A. Goeden, D. J. Rose, B. Mau, and Y. Shao. 1997. The complete genome sequence of Escherichia coli K-12. Science 2771453-1474. - PubMed
    1. Blum, P., J. Ory, J. Bauernfeind, and J. Krska. 1992. Physiological consequences of DnaK and DnaJ overproduction in Escherichia coli. J. Bacteriol. 1747436-7444. - PMC - PubMed
    1. Bukau, B., and G. C. Walker. 1989. Cellular defects caused by deletion of the Escherichia coli dnaK gene indicate roles for heat shock protein in normal metabolism. J. Bacteriol. 1712337-2346. - PMC - PubMed

Publication types

MeSH terms

LinkOut - more resources