. 2009 Mar;77(3):1246-61.
doi: 10.1128/IAI.01038-08. Epub 2008 Dec 29.

Porphyromonas gingivalis RgpA-Kgp proteinase-adhesin complexes penetrate gingival tissue and induce proinflammatory cytokines or apoptosis in a concentration-dependent manner

Affiliations

Porphyromonas gingivalis RgpA-Kgp proteinase-adhesin complexes penetrate gingival tissue and induce proinflammatory cytokines or apoptosis in a concentration-dependent manner

Neil M O'Brien-Simpson et al. Infect Immun. 2009 Mar.

Abstract

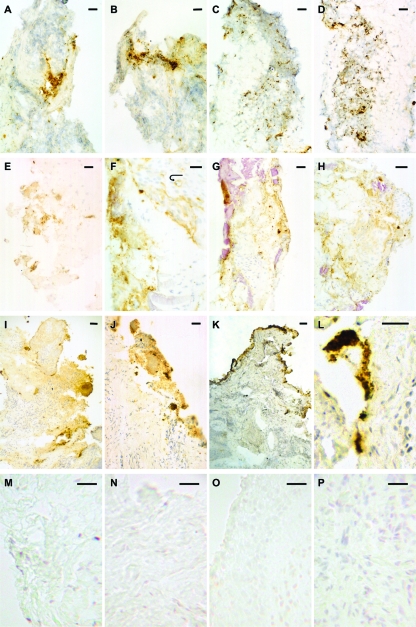
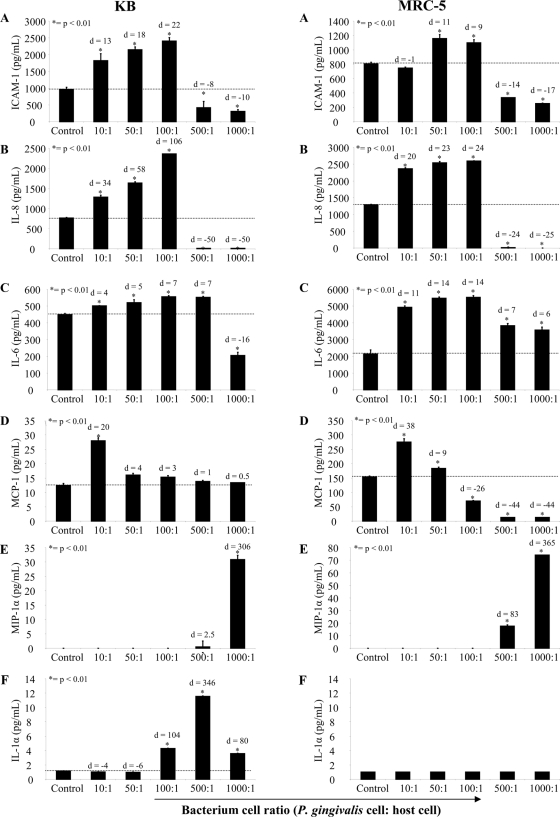
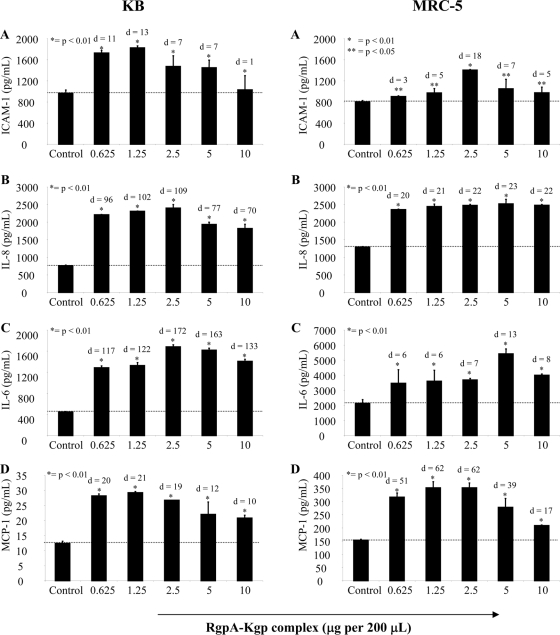
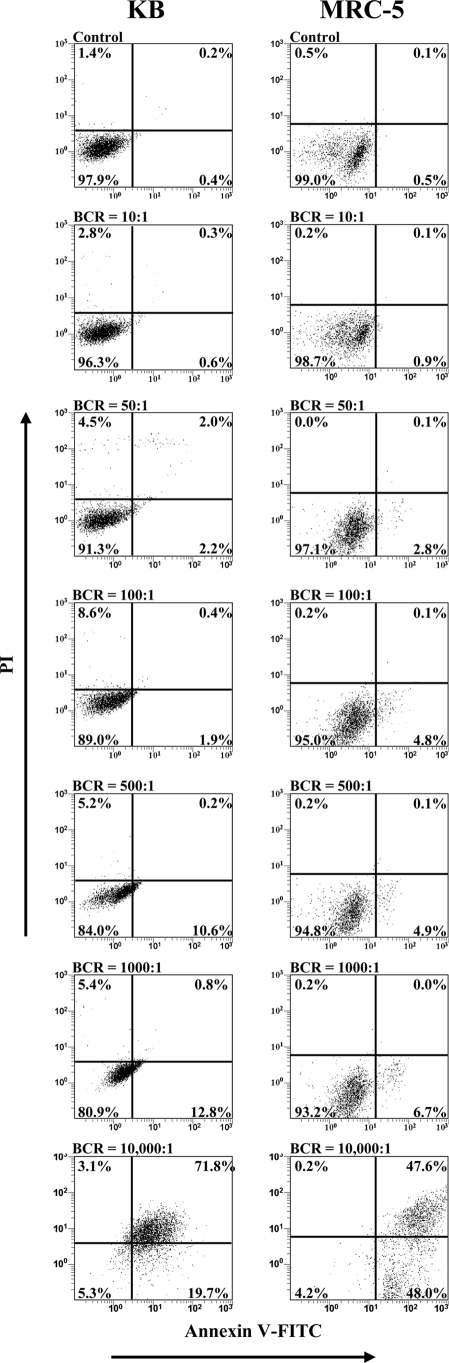
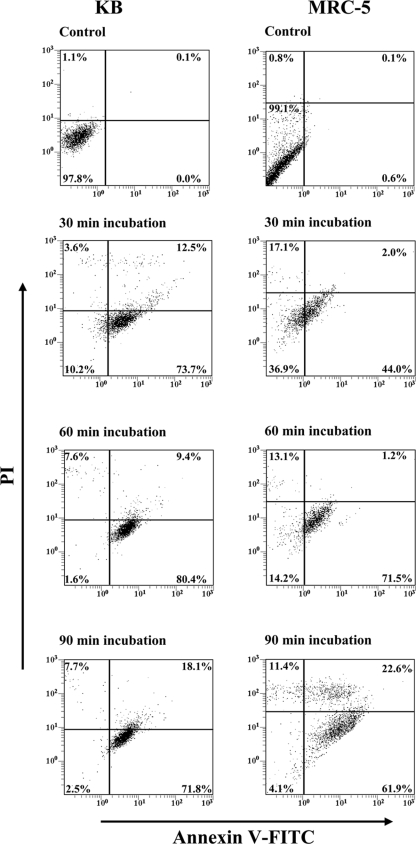
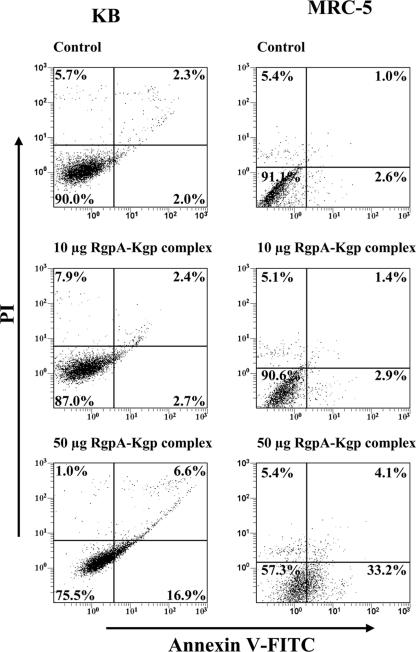
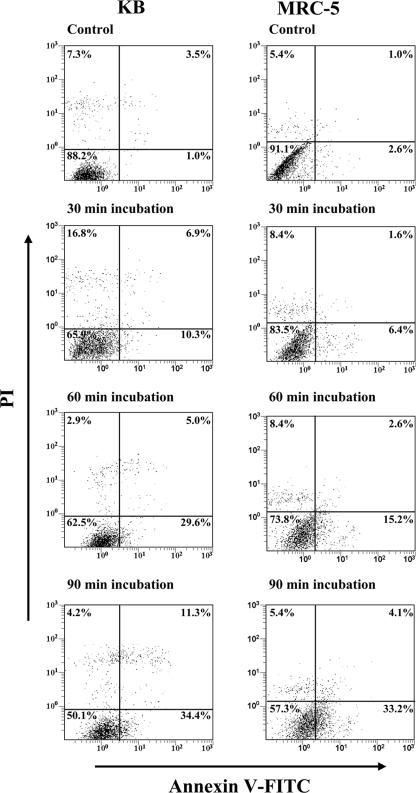
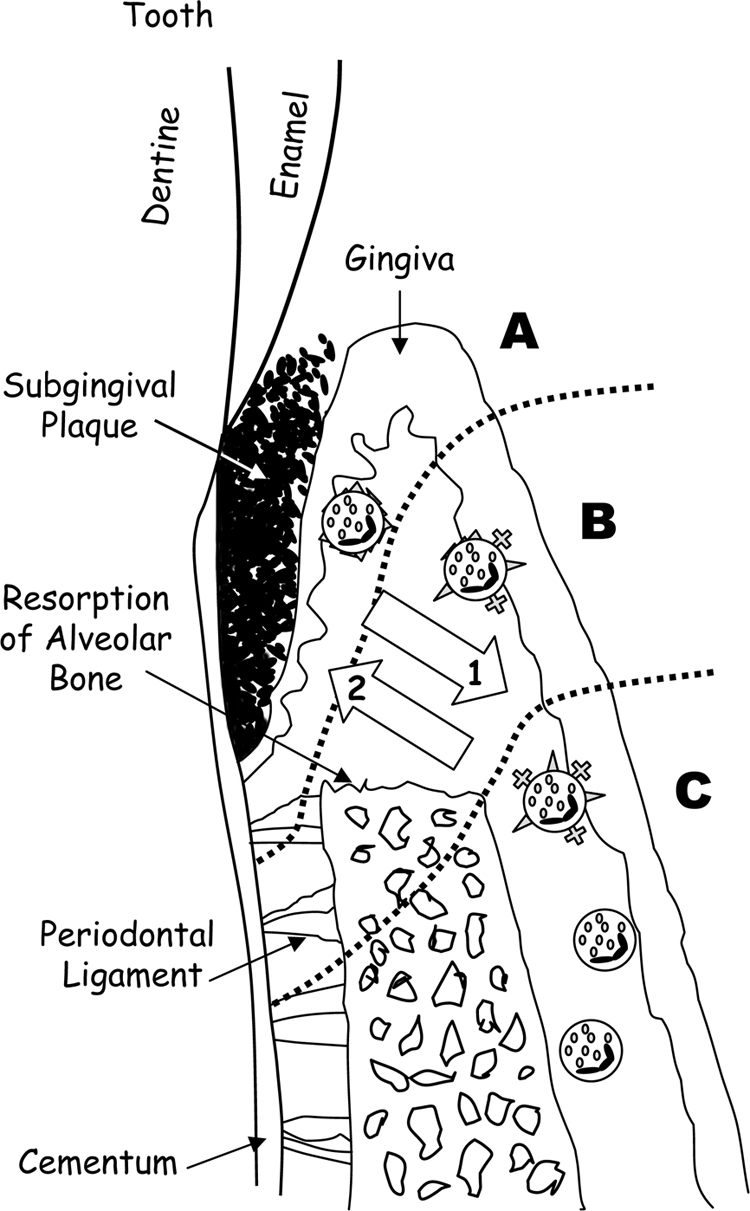
The RgpA-Kgp proteinase-adhesin complexes of Porphyromonas gingivalis were observed, using immunostaining, in human gingival tissue associated with periodontitis but not in healthy tissue. The staining pattern suggested a concentration gradient from the subgingival plaque into the subjacent gingival connective tissue. Intense immunostaining was observed in areas displaying gross disturbance of tissue architecture. P. gingivalis cells and the RgpA-Kgp complexes at low concentrations were shown to stimulate secretory intercellular adhesion molecule 1, interleukin-8 (IL-8), IL-6, and macrophage chemoattractant protein secretion from cultured human epithelial (KB) and fibroblast (MRC-5) cells. However, at high concentrations a reduction in the level of these mediators was observed. In contrast, macrophage inflammatory protein 1alpha and IL-1alpha were stimulated only at high P. gingivalis cell concentrations. P. gingivalis cells and the RgpA-Kgp complexes were shown to induce apoptosis in KB and MRC-5 cells in a time- and dose-dependent manner. These data suggest that the RgpA-Kgp complexes penetrate the gingival connective tissue; at low concentrations distal from the plaque the complexes stimulate the secretion of proinflammatory mediators, while at high concentrations proximal to the plaque they induce apoptosis and attenuate the secretion of proinflammatory mediators.


Figures

FIG. 1.
FIG. 1.
Photomicrographs of frozen sections of gingival tissue associated with chronic periodontitis, GAP, and periodontal health/gingivitis stained for the P. gingivalis RgpA-Kgp proteinase-adhesin complexes. Panels A to D show sections of diseased tissue from a previously untreated GAP patient that demonstrate discrete staining, observed as dark brown spots often in aggregates (especially panels B and D), as well as less intense diffuse staining, observed as a light brown “smear” around the discrete staining. The diffuse staining is also seen in areas devoid of the discrete staining. Note the large amount of discrete staining scattered among inflammatory cells in panels C and D. Panels E to H show sections of diseased tissue from a previously treated chronic periodontitis patient. Note the comparatively high proportions of diffuse staining in these panels. Panel E contains mostly diffuse staining, whereas panels F to H show both discrete and diffuse staining with relatively large amounts of diffuse staining also observed independent of the discrete staining. The arrow in panel F points to diffuse staining associated with a small blood vessel extending around its entire circumference. The pink amorphous material observed in panels G and H represents plaque bacteria. Panel I shows a section of diseased tissue from another previously treated chronic periodontitis patient, showing mostly diffuse staining associated with a moderately dense inflammatory cell infiltrate. Spots indicating discrete staining, some in small aggregates, are also evident. Panels J and K show sections of diseased tissue from another previously treated chronic periodontitis patient that contain discrete stains of various sizes, sometimes in aggregates, along with moderate amounts of surrounding diffuse staining. Panel L shows a section of diseased tissue from another previously treated chronic periodontitis patient that contains discrete stains, mostly in aggregates, along with surrounding diffuse staining. Panels M to P show sections of control tissue (healthy or gingivitis only) from four different patients that demonstrate the absence of either discrete or diffuse staining in areas with various amounts of inflammatory cell infiltrate. Scale bars: 30 μm (A to E, G, H, J, L to P), 20 μm =(F), and 50 μm (I and K).
FIG. 2.
FIG. 2.
Secretion of sICAM-1, IL-8, IL-6, MCP-1, MIP-1α, and IL-1α by KB and MRC-5 cells following incubation with viable P. gingivalis W50 whole cells. Confluent KB and MRC-5 cell monolayers were incubated with P. gingivalis W50 at various BCRs (10:1. 50:1, 100:1 500:1, 1,000:1, and 10,000:1 for 90 min at 37°C. After incubation, P. gingivalis was removed, and the cell monolayers were incubated with fresh culture medium for a further 16 h at 37°C. Following incubation, the culture supernatants were collected and assayed for sICAM-1, IL-8, IL-6, MCP-1, MIP-1α, and IL-1α by ELISA. The values represent the means and standard deviations of triplicate determinations from three representative experiments. The dotted line represents basal cytokine levels as determined by unstimulated cells (control). Data were analyzed by a t test and effect size (Cohen's d) compared to the control.
FIG. 3.
FIG. 3.
Secretion of sICAM-1, IL-8, MCP-1, and IL-6 by KB and MRC-5 cells following incubation with P. gingivalis RgpA-Kgp complexes. Confluent KB and MRC-5 cell monolayers were incubated with RgpA-Kgp complexes at various concentrations (0.625, 1.25, 2.5, 5, and 10 μg) equivalent to BCRs of 12.5:1, 25:1, 50:1, 100:1, and 200:1, respectively, for 90 min at 37°C. After incubation, the cells were washed and incubated with fresh culture medium for another 16 h at 37°C. Following incubation, the culture supernatants were assayed for sICAM-1, IL-8, IL-6, MCP-1, and IL-6 by ELISA. The values represent the mean and standard deviation of triplicate determinations from three representative experiments. The dotted line represents basal cytokine levels as determined by unstimulated cells (control). Data were analyzed by a t test and effect size (Cohen's d) compared to control.
FIG. 4.
FIG. 4.
Induction of apoptosis in KB and MRC-5 cells after incubation with P. gingivalis W50 at various BCRs. Confluent monolayers of KB and MRC-5 cells were incubated with P. gingivalis W50 at various BCRs (10:1, 50:1, 100:1, 500:1, 1,000:1, and 10,000:1) for 90 min at 37°C. The cells were stained simultaneously with annexin V-FITC and PI and then analyzed on a FACSCalibur flow cytometer to determine the proportion of apoptotic and viable cells. The quadrants on the two-dimensional dot plots were set based upon healthy untreated cells (Control). The lower-left quadrant represents viable cells negative for both annexin V-FITC and PI. The lower-right quadrant represents a PI-negative, annexin V-FITC-positive early apoptotic cell population. The upper-left quadrant represents PI-positive, annexin V-FITC-negative necrotic cells with a permeabilized membrane only. The upper-right quadrant represents an annexin V-FITC- and PI-positive late apoptotic/necrotic cell population. Analysis is based on duplicate samples of 10,000 cells, and the data are representative of three experiments.
FIG. 5.
FIG. 5.
Time course analysis of KB and MRC-5 cell apoptosis induction by P. gingivalis W50. Confluent monolayers of KB and MRC-5 cells were incubated for 30, 60, and 90 min with P. gingivalis at a BCR of 10,000:1. The cells were stained simultaneously with annexin V-FITC and PI and then analyzed on a FACSCalibur flow cytometer to determine the proportion of apoptotic and viable cells. The quadrants on the two-dimensional dot plots were set based upon healthy untreated cells (Control). The lower-left quadrant represents viable cells negative for both annexin V-FITC and PI. The lower-right quadrant represents the PI-negative, annexin V-FITC-positive early apoptotic cell population. The upper-left quadrant represents PI-positive, annexin V-FITC-negative necrotic cells with a permeabilized membrane only. The upper-right quadrant represents the annexin V-FITC- and PI-positive late apoptotic/necrotic cell population. Analysis is based on duplicate samples of 10,000 cells, and the data are representative of three experiments.
FIG. 6.
FIG. 6.
KB and MRC-5 cell apoptosis induced after incubation with RgpA-Kgp complexes at various concentrations. Confluent monolayers of KB and MRC-5 cells were incubated with 10 μg and 50 μg of RgpA-Kgp complexes (equivalent to BCRs of 200:1 and 1,000:1, respectively) for 90 min at 37°C. The KB and MRC-5 ells were stained simultaneously with annexin V-FITC and PI and then analyzed on a FACSCalibur flow cytometer to determine the proportion of apoptotic and viable cells. The quadrants on the two-dimensional dot plots were set based upon healthy untreated cells (Control). The lower-left quadrant represents viable cells negative for both annexin V-FITC and PI. The lower-right quadrant represents the PI-negative, annexin V-FITC-positive early apoptotic cell population. The upper-left quadrant represents PI-positive, annexin V-FITC-negative necrotic cells with a permeabilized membrane only. The upper-right quadrant represents the annexin V-FITC- and PI-positive late apoptotic/necrotic cell population. Analysis is based on duplicate samples of 10,000 cells, and the data are representative of three experiments.
FIG. 7.
FIG. 7.
Time course analysis of KB and MRC-5 cell apoptosis induction by RgpA-Kgp complexes. Confluent monolayers of KB and MRC-5 cells were incubated with 50 μg of RgpA-Kgp complexes (equivalent to a BCR of 1,000:1) for 30, 60, and 90 min. The KB and MRC-5 cells were stained with annexin V-FITC and PI and then analyzed on a FACSCalibur flow cytometer to determine the proportion of apoptotic/necrotic and viable cells. The quadrants on the two-dimensional dot plots were set based upon healthy untreated cells (Control). The lower-left quadrant represents viable cells negative for both annexin V-FITC and PI. The lower-right quadrant represents the PI-negative, annexin V-FITC-positive early apoptotic cell population. The upper-left quadrant represents PI-positive, annexin V-FITC-negative necrotic cells with a permeabilized membrane only. The upper-right quadrant represents the annexin V-FITC- and PI-positive late apoptotic/necrotic cell population. Analysis is based on duplicate samples of 10,000 cells, and the data are representative of three experiments.
FIG. 8.
FIG. 8.
Schematic representation of a progressive periodontal lesion. (A) The area shows a high concentration of the RgpA-Kgp complexes, high level of host cell surface receptor, cytokine/chemokine degradation, apoptosis, and inflammation. (B) Decreasing concentrations of the RgpA-Kgp complexes result in decreased host cell surface receptor, cytokine/chemokine degradation, and apoptosis, but there is still a strong inflammatory response leading to bone resorption and host cell recruitment and activation. (C) Low concentrations of the RgpA-Kgp complexes and bacterial products result in host cell stimulation and recruitment and activation of host immune cells. Arrow 1 indicates the decreasing concentration of the RgpA-Kgp complexes and bacterial products in host tissue; arrow 2 indicates increasing dysregulation of the immune response.

References

    1. Ansai, T., E. Yamamoto, S. Awano, W. Yu, A. J. Turner, and T. Takehara. 2002. Effects of periodontopathic bacteria on the expression of endothelin-1 in gingival epithelial cells in adult periodontitis. Clin. Sci. (London) 103327S-331S. - PubMed
    1. Assuma, R., T. Oates, D. Cochran, S. Amar, and D. T. Graves. 1998. IL-1 and TNF antagonists inhibit the inflammatory response and bone loss in experimental periodontitis. J. Immunol. 160403-409. - PubMed
    1. Aubry, J. P., A. Blaecke, S. Lecoanet-Henchoz, P. Jeannin, N. Herbault, G. Caron, V. Moine, and J. Y. Bonnefoy. 1999. Annexin V used for measuring apoptosis in the early events of cellular cytotoxicity. Cytometry 37197-204. - PubMed
    1. Banbula, A., M. Bugno, A. Kuster, P. C. Heinrich, J. Travis, and J. Potempa. 1999. Rapid and efficient inactivation of IL-6 gingipains, lysine- and arginine-specific proteinases from Porphyromonas gingivalis. Biochem. Biophys. Res. Commun. 261598-602. - PubMed
    1. Bascones, A., J. Gamonal, M. Gomez, A. Silva, and M. A. Gonzalez. 2004. New knowledge of the pathogenesis of periodontal disease. Quintessence Int. 35706-716. - PubMed

Publication types

MeSH terms

LinkOut - more resources