. 2008 Dec 29;183(7):1243-57.
doi: 10.1083/jcb.200807130.

Coordinated control of self-renewal and differentiation of neural stem cells by Myc and the p19ARF-p53 pathway

Affiliations

Coordinated control of self-renewal and differentiation of neural stem cells by Myc and the p19ARF-p53 pathway

Motoshi Nagao et al. J Cell Biol. .

Abstract

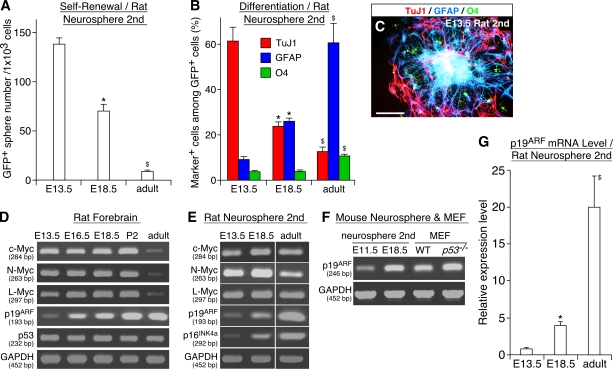
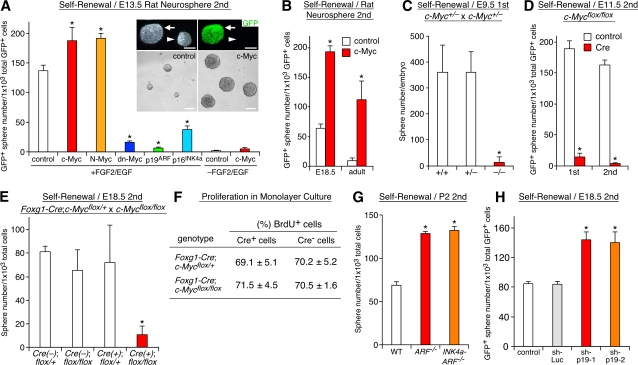
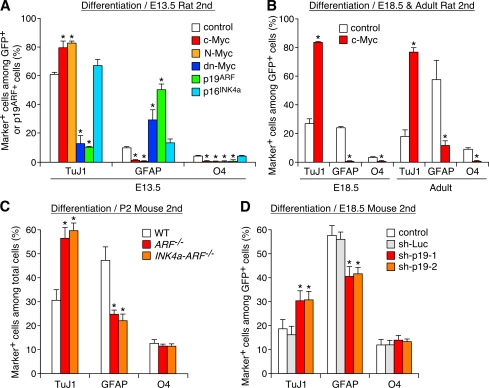
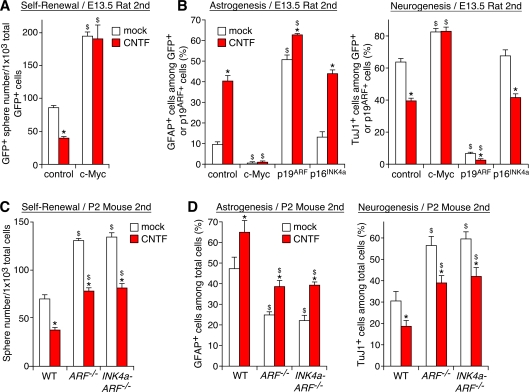
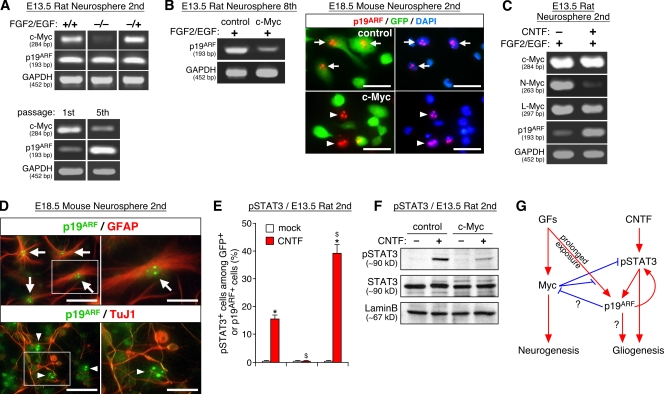
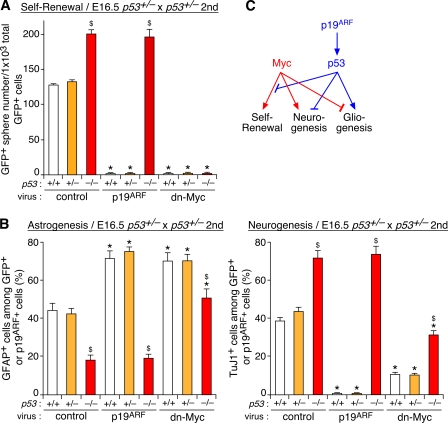
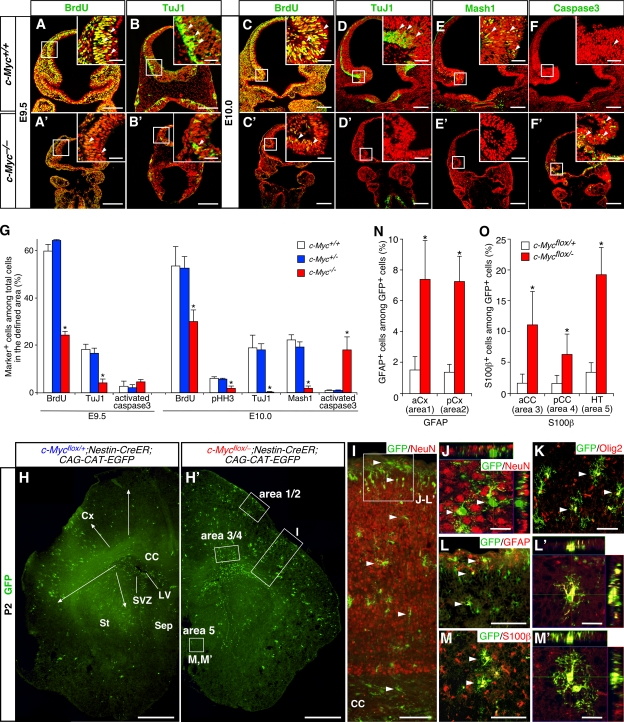
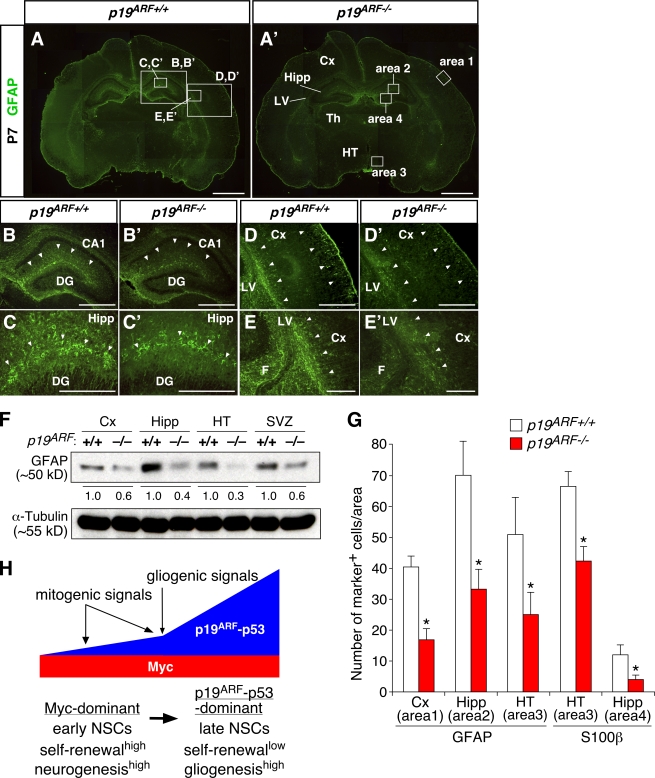
The modes of proliferation and differentiation of neural stem cells (NSCs) are coordinately controlled during development, but the underlying mechanisms remain largely unknown. In this study, we show that the protooncoprotein Myc and the tumor suppressor p19(ARF) regulate both NSC self-renewal and their neuronal and glial fate in a developmental stage-dependent manner. Early-stage NSCs have low p19(ARF) expression and retain a high self-renewal and neurogenic capacity, whereas late-stage NSCs with higher p19(ARF) expression possess a lower self-renewal capacity and predominantly generate glia. Overexpression of Myc or inactivation of p19(ARF) reverts the properties of late-stage NSCs to those of early-stage cells. Conversely, inactivation of Myc or forced p19(ARF) expression attenuates self-renewal and induces precocious gliogenesis through modulation of the responsiveness to gliogenic signals. These actions of p19(ARF) in NSCs are mainly mediated by p53. We propose that opposing actions of Myc and the p19(ARF)-p53 pathway have important functions in coordinated developmental control of self-renewal and cell fate choices in NSCs.


Figures

Figure 1.
Figure 1.
Parallel developmental changes in the properties of NSCs and the expression level of p19ARF. (A–C) Developmental changes in the self-renewal and differentiation potential of NSCs at different stages. NSCs were isolated as neurospheres from rat forebrains at various stages, and their self-renewal activity (A) and differentiation potential (B) were examined. The photograph in C shows clonal neurospheres derived from E13.5 embryos stained for TuJ1 (red), GFAP (blue), and O4 (green). (D–F) The mRNA level of various genes in freshly isolated rat forebrains (D) and neurospheres derived from those tissues (E) is compared by RT-PCR using GAPDH as an internal control. In F, p19ARF expression is compared between E11.5 and E18.5 mouse neurospheres and WT and p53−/− mouse embryo fibroblasts. The sizes of PCR products are shown in base pairs below the gene names. (G) Developmental change in the p19ARF mRNA expression level. *, P < 0.01 compared with values in culture of E13.5 cells; $, P < 0.01 compared with values in culture of E18.5 cells. MEF, mouse embryo fibroblast. Error bars indicate mean + SD. Bar, 100 μm.
Figure 2.
Figure 2.
Regulation of NSC self-renewal by Myc and p19ARF. (A and B) Effects of retrovirus-mediated overexpression of Myc and p19ARF on self-renewal. The frequency of neurosphere-forming cells among total virus-infected (GFP+) cells is compared using cells derived from different stages. Secondary (2nd) spheres were used for virus infection. Top insets show phase-contrast (left) and fluorescent (right) images of GFP virus–infected (arrows) and uninfected (arrowheads) neurospheres. Bottom insets show larger neurospheres formed by c-Myc–expressing cells (right) compared with those of control cells. (C–E) Effects of inactivation of c-Myc on self-renewal. In C, the frequency of neurosphere-forming cells in the forebrain is compared with c-Myc+/+, c-Myc+/−, and c-Myc−/− mice. In D and E, c-Myc was conditionally inactivated either by infection with Cre viruses in vitro (D) or by crossing with Foxg1-Cre mice using c-Mycflox/flox mice in vivo (E). The formation of neurospheres by cells with different genotypes is compared. (F) Effect of c-Myc inactivation on proliferation in monolayer. Forebrain neuroepithelial cells from Foxg1-Cre;c-Mycflox/+ and Foxg1-Cre;c-Mycflox/flox embryos were cultured in monolayer and labeled with BrdU for 48 h in the presence of FGF2 and EGF. The percentage of BrdU+ cells among Cre+ (c-Myc inactivated) and Cre (WT) cells was quantified. (G and H) Effects of inactivation in vivo (G) and acute down-regulation in vitro (H) of p19ARF on self-renewal. In G, WT, p19ARF−/−, and p19ARF−/−;p16INK4a−/− mice are compared. In H, short hairpin–p19-1 and -2 are retroviruses expressing shRNAs for p19ARF, whereas short hairpin–Luc expresses shRNA for luciferase. *, P < 0.01 compared with control virus–infected culture (A, B, D, and H) or c-Myc+/+ (C), Foxg1-Cre;c-Mycflox/+ (E and F), and WT (G) mice. Error bars indicate mean + SD. Bars, 100 μm.
Figure 3.
Figure 3.
Regulation of neurogenesis and gliogenesis by Myc and p19ARF. (A and B) Effects of Myc and p19ARF on differentiation of NSCs. The percentages of neurons and glia among total virus-infected cells are compared. (C and D) Effects of inactivation in vivo (C) and acute down-regulation in vitro (D) of p19ARF on neurogenesis and gliogenesis. *, P < 0.01 compared with control virus–infected culture (A, B, and D) or WT mice (C). Error bars indicate mean + SD.
Figure 4.
Figure 4.
Modulation of CNTF actions by Myc and p19ARF. (A) Block of CNTF-dependent inhibition of self-renewal by Myc. Control and c-Myc–expressing cells were subjected to the neurosphere formation assay in the presence of CNTF. (B) Effects of c-Myc, p19ARF, and p16INK4a on CNTF-dependent stimulation of astrogenesis (left) and inhibition of neurogenesis (right). Virus-infected cells were induced to differentiate in the presence of CNTF. (C and D) Effects of inactivation of p19ARF and p16INK4a on CNTF-dependent regulation of self-renewal (C) and differentiation (D). *, P < 0.01 compared with mock-treated culture; $, P < 0.01 compared with control virus–infected culture (A and B) or WT mice (C and D). Error bars indicate mean + SD.
Figure 5.
Figure 5.
Regulation of Myc and p19ARF expression by growth factors and gliogenic signals. (A) Growth factor–dependent regulation of Myc and p19ARF expression. (top) Neurospheres expanded in the presence of FGF2 and EGF for 3 d (+/+) were starved for 6 h and subsequently reexposed to growth factors for an additional 2 h (−/+) or left unexposed (−/−). (bottom) Neurospheres were serially passaged, and the level of c-Myc and p19ARF mRNAs was compared with the first and fifth spheres. (B) Suppression of p19ARF expression by Myc. The cells examined are control and c-Myc virus–infected neurospheres derived from E13.5 (eighth passage; left) and E18.5 (second passage; right). p19ARF was detected in DAPI+ cell nuclei of control (arrows) but not c-Myc (arrowheads) cells. (C) Regulation of p19ARF and N-Myc by CNTF. Neurospheres were grown in the presence (+) or absence (−) of CNTF for 7 d. (D) Expression of p19ARF in astrocytes. Photographs show the localization of p19ARF in the nucleoli of astrocytes (top, arrows) but not of neurons (bottom, arrowheads). The panels on the right show higher magnification views of the areas indicated by boxes on the left. (E and F) Effects of Myc and p19ARF on CNTF-dependent STAT3 phosphorylation at Y705 (pSTAT3). (G) Model for the relationships of Myc and p19ARF with extracellular signals and neuro/gliogenesis. Arrows and blunt-ended lines indicate stimulation and inhibition, respectively, either at the level of expression or function. The sizes of PCR products are shown in base pairs below the gene names. *, P < 0.01 compared with mock-treated culture; $, P < 0.01 compared with control virus–infected culture. Error bars indicate mean + SD. Bars: (B) 25 μm; (D) 40 μm.
Figure 6.
Figure 6.
Involvement of p53 in Myc- and p19ARF-dependent regulation of NSCs. (A and B) Forebrain neurospheres derived from p53+/+, p53+/−, and p53−/− embryos were infected with control, p19ARF, and dn-Myc viruses and were subsequently subjected to the self-renewal (A) and differentiation (B) assays as described in Figs. 2 and 3. (C) Model for the relationships between Myc, p19ARF, and p53. *, P < 0.01 compared with control virus–infected culture with the same genotypes; $, P < 0.01 compared with WT (+/+) cells infected with the same viruses. Error bars indicate mean + SD.
Figure 7.
Figure 7.
Impaired neurogenesis and gliogenesis caused by inactivation of c-Myc in vivo. (A–G) Defects in proliferation and neurogenesis in forebrains of c-Myc−/− mice at E9.5 and E10.0. In A–F′, stained markers are shown in green, and cell nuclei were visualized with PI in red. Insets show higher magnification views of boxed areas. BrdU was administered to pregnant dams 30 min before sampling. G shows a comparison of the percentages of marker-positive cells (arrowheads) among total cells in the areas boxed in A–F′ between c-Myc+/+, c-Myc+/−, and c-Myc−/− embryos. *, P < 0.01 compared with c-Myc+/+ mice. (H–O) Accelerated differentiation of astrocytes by conditional inactivation of c-Myc at late embryonic stages. Tamoxifen was administered to pregnant dams at E16.5 or E17.5, and pups were analyzed at P2 or 3. c-Myc–inactivated cells were visualized as GFP+ cells using CAG-CAT-EGFP Cre reporter. H and H′ show the distribution pattern of GFP+ cells in coronal sections of the forebrain. The arrows indicate migration of GFP+ cells from the subventricular zone (SVZ) toward the outer brain parenchyma. I–M′ show the phenotypes of GFP+ cells (arrowheads) in the neocortex (I–L′) and hypothalamus (M and M′) of c-Mycflox/+;Nestin-CreER;CAG-CAT-EGFP mice. The position of the areas shown in J–L′ is indicated by a box in I. N and O show the comparison of the percentages of GFAP+ and S100β+ cells among GFP+ cells with c-Mycflox/+ and c-Mycflox/− genotypes in the regions indicated by boxes in H′. *, P < 0.01 compared with c-Mycflox/+;Nestin-CreER cells. aCC, anterior corpus callosum; pCC, posterior corpus callosum; aCx, anterior neocortex; pCx, posterior neocortex; CC, corpus callosum; Cx, neocortex; HT, hypothalamus; LV, lateral ventricle; Sep, septum; St, striatum. Error bars indicate mean + SD. Bars: (A–F′) 200 μm; (A–F′, insets) 40 μm; (H and H′) 500 μm; (I, L, and M) 100 μm; (J, L′, and M′) 20 μm; (K) 50 μm.
Figure 8.
Figure 8.
Attenuated astrocyte differentiation in early postnatal brains of p19ARF mutants. (A–E′) GFAP staining of the WT (p19ARF+/+) and p19ARF−/− brains at P7. B–E′ show higher magnification views of the areas indicated by boxes in A. Differential staining patterns between the WT and mutant are highlighted by arrowheads. (F) Expression level of GFAP in various regions of p19ARF+/+ and p19ARF−/− mice. The level of GFAP proteins in the mutant relative to the WT (designated as 1.0) is indicated. (G) Comparison of the numbers of GFAP+ and S100β+ astrocytes in specific regions of the brain. The locations of areas 1–4 are indicated by boxes in A′. (H) Model for the actions of Myc and the p19ARF–p53 pathway in developmental control of NSCs. Arrows at the top indicate stimulation, and the thick horizontal arrow indicates transition from early- to late-stage cells. *, P < 0.01 compared with the WT. CA1, hippocampal CA1 sector; Cx, neocortex; DG, dentate gyrus; F, fimbria; Hipp, hippocampus; HT, hypothalamus; LV, lateral ventricle; Th, thalamus; SVZ, subventricular zone. Error bars indicate mean + SD. Bars: (A and A′) 1 mm; (B, B′, D, and D′) 500 μm; (C, C′, E, and E′) 200 μm.

References

    1. Bachoo, R.M., E.A. Maher, K.L. Ligon, N.E. Sharpless, S.S. Chan, M.J. You, Y. Tang, J. DeFrances, E. Stover, R. Weissleder, et al. 2002. Epidermal growth factor receptor and Ink4a/Arf: convergent mechanisms governing terminal differentiation and transformation along the neural stem cell to astrocyte axis. Cancer Cell. 1:269–277. - PubMed
    1. Barnabe-Heider, F., J.A. Wasylnka, K.J. Fernandes, C. Porsche, M. Sendtner, D.R. Kaplan, and F.D. Miller. 2005. Evidence that embryonic neurons regulate the onset of cortical gliogenesis via cardiotrophin-1. Neuron. 48:253–265. - PubMed
    1. Berns, K., E.M. Hijmans, and R. Bernards. 1997. Repression of c-Myc responsive genes in cycling cells causes G1 arrest through reduction of cyclin E/CDK2 kinase activity. Oncogene. 15:1347–1356. - PubMed
    1. Bruggeman, S.W., and M. van Lohuizen. 2006. Controlling stem cell proliferation: CKIs at work. Cell Cycle. 5:1281–1285. - PubMed
    1. Bruggeman, S.W., M.E. Valk-Lingbeek, P.P. van der Stoop, J.J. Jacobs, K. Kieboom, E. Tanger, D. Hulsman, C. Leung, Y. Arsenijevic, S. Marino, and M. van Lohuizen. 2005. Ink4a and Arf differentially affect cell proliferation and neural stem cell self-renewal in Bmi1-deficient mice. Genes Dev. 19:1438–1443. - PMC - PubMed

Publication types

MeSH terms

Substances