. 2009 Jan;133(1):111-27.
doi: 10.1085/jgp.200810154.

Molecular basis for cation selectivity in claudin-2-based paracellular pores: identification of an electrostatic interaction site

Affiliations

Molecular basis for cation selectivity in claudin-2-based paracellular pores: identification of an electrostatic interaction site

Alan S L Yu et al. J Gen Physiol. 2009 Jan.

Abstract

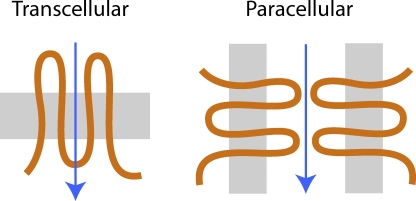
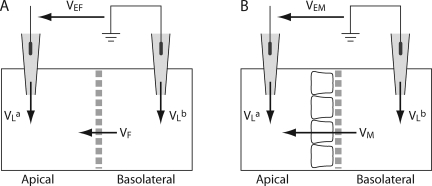
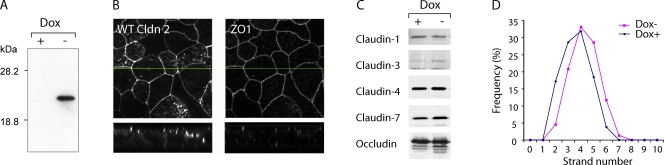
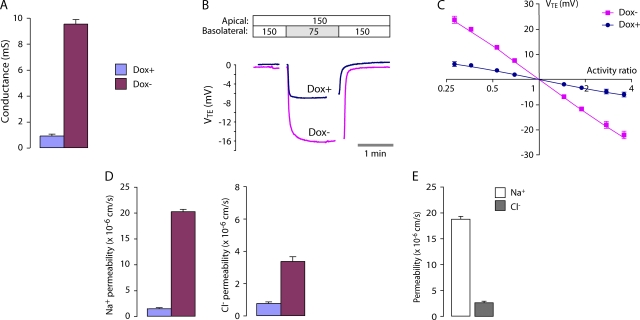
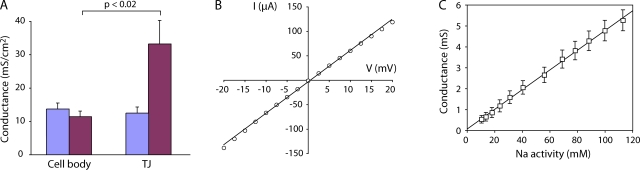
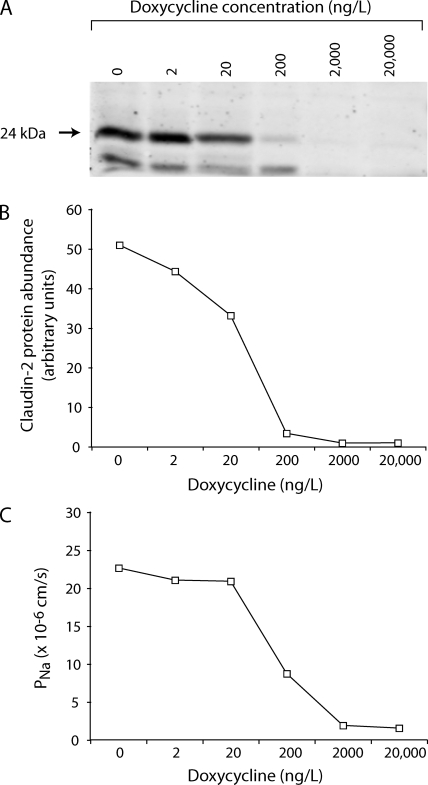
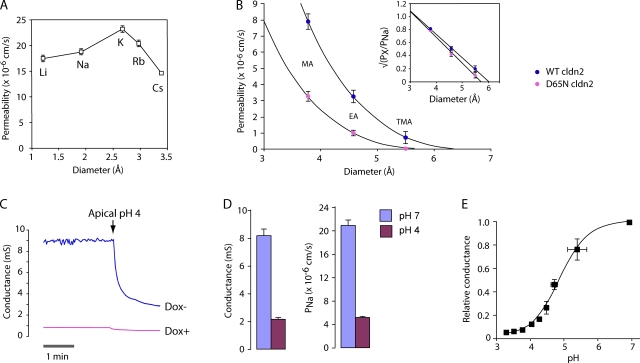
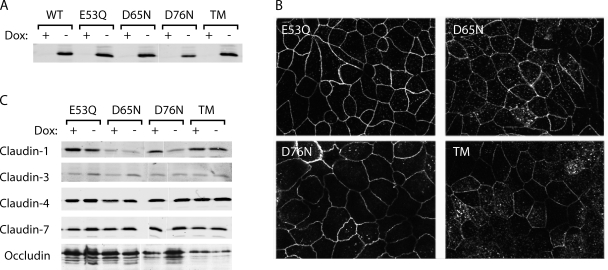
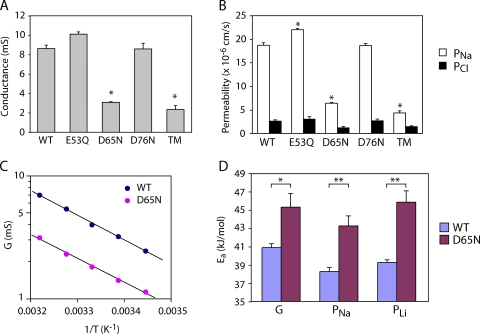
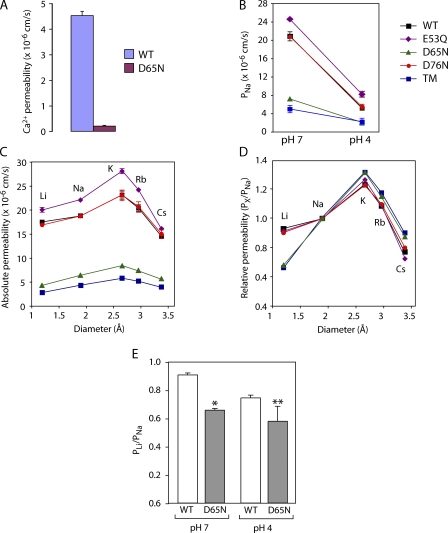
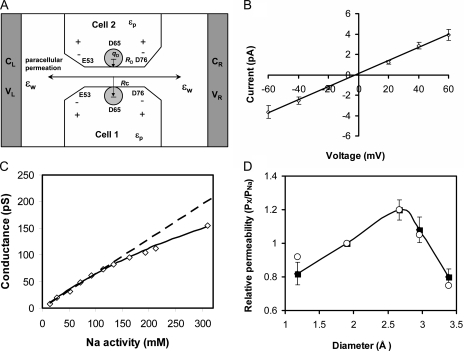
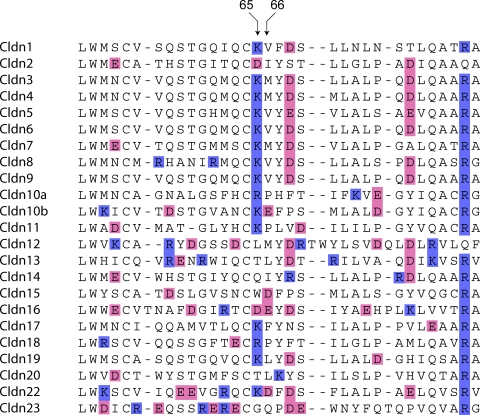
Paracellular ion transport in epithelia is mediated by pores formed by members of the claudin family. The degree of selectivity and the molecular mechanism of ion permeation through claudin pores are poorly understood. By expressing a high-conductance claudin isoform, claudin-2, in high-resistance Madin-Darby canine kidney cells under the control of an inducible promoter, we were able to quantitate claudin pore permeability. Claudin-2 pores were found to be narrow, fluid filled, and cation selective. Charge selectivity was mediated by the electrostatic interaction of partially dehydrated permeating cations with a negatively charged site within the pore that is formed by the side chain carboxyl group of aspartate-65. Thus, paracellular pores use intrapore electrostatic binding sites to achieve a high conductance with a high degree of charge selectivity.


Figures

Figure 1.
Figure 1.
Comparison of the different transepithelial transport routes. Transcellular/transmembrane channels (left) mediate ion transport (arrow) perpendicular to the plane of the lipid bilayer (gray), with the pore wall formed predominantly by intramembrane domains of the channel polypeptide (orange). Paracellular pores such as claudins (right) mediate transport parallel to and extracellular to the lipid bilayer, with the pore walls presumably constituted by the extracellular domains of claudin polypeptides.
Figure 2.
Figure 2.
Ussing chamber setup and method of correcting for junction potentials. The sign of the potential is indicated by the arrows, which show the potential of the arrow head with respect to the arrow tail. Liquid junction potentials in the agar bridge pipettes (VLa and VLb) are calculated as the potential of the solution with respect to the pipette. VEF and VEM are the apparent apical-basolateral potentials that are measured experimentally. (A) Setup with only a blank filter inserted between the hemichambers. The potential across the blank filter, VF, is defined as the apical potential with respect to the basolateral side. (B) Setup with a filter on which a monolayer of cells has been cultured. The potential across the monolayer and its filter is VM.
Figure 3.
Figure 3.
Characterization of MDCK I TetOff cells stably transfected with WT claudin-2. (A) Immunoblot of claudin-2 in lysate from cells grown in the presence (+) or absence (−) of doxycycline (Dox). (B) Double immunofluorescence staining of Dox− cells using an antibody to claudin-2 (left) and ZO-1 (right). En face confocal images (top) and vertical images (bottom) at the position indicated by the green line are shown. (C) Effect of claudin-2 induction on expression of other tight junction membrane proteins. Cell lysates were immunoblotted with antibodies against the indicated claudin isoforms or occludin. (D) Frequency histogram of tight junction strand counts measured in freeze-fracture replicas (154 counts per replica). Median strand number for both Dox+ and Dox− cells was 4.
Figure 4.
Figure 4.
Conductance and NaCl permeability of the WT claudin-2 pore. (A) Transepithelial conductance in MDCK I TetOff cells that were either uninduced (Dox+) or induced to express WT claudin-2 (Dox−). Columns show mean ± SE (n = 3 monolayers in a single experiment) and are representative of four independent experiments. (B) Raw voltage traces, VTE (apical with reference to basolateral), acquired in a typical NaCl dilution potential experiment. The NaCl concentrations of the Ringer solutions on each side of the monolayers are shown at the top (in mM). Gaps in acquisition occurred during solution exchange. (C) Determination of relative permeability from NaCl dilution potentials. The transepithelial diffusion potential, VTE, was determined at different NaCl activity ratios (apical activity/basolateral activity) and plotted on a log-linear scale. Data were fit by nonlinear regression to the Goldman-Hodgkin-Katz equation with best-fit values (95% CI) for PNa/PCl of 1.5 (1.4–1.6) for Dox+ and 6.3 (5.7–6.8) for Dox−. (D) Permeability to Na+ and Cl in Dox+ and Dox− cells, determined from dilution potential measurements (see A for color code). (E) Apparent permeability of the claudin-2 pore to Na+ and Cl, determined by subtracting measurements in Dox+ cells from those in Dox− cells.
Figure 5.
Figure 5.
Characteristics of the WT claudin-2 pore conductance. (A) Conductance scanning to distinguish the effect of claudin-2 on transcellular from paracellular conductance. Transcellular conductance was determined by scanning above the cell body, and paracellular conductance was determined by scanning over the lateral cell border (TJ). Results show the mean of 12–15 conductance measurements per site performed on two filters each. (B) Relationship between transepithelial voltage (V) and the current (I) carried by claudin-2. (C) Relationship between extracellular Na+ activity and claudin-2 conductance. Na+ concentration was adjusted by isosmotic replacement of NaCl with mannitol.
Figure 6.
Figure 6.
Dose–response relationship between claudin-2 protein level and Na+ permeability. (A) Immunoblot showing expression of WT claudin-2 (24 kD band) induced (no doxycycline) or suppressed with varying concentrations of doxycycline. (B) Quantitation of immunoblot bands to assess claudin-2 protein abundance. (C) Permeability to Na+ (PNa), as determined by NaCl dilution potential measurement.
Figure 7.
Figure 7.
Biophysical properties of the WT claudin-2 pore. (A) Permeability of WT claudin-2 to alkali metal cations, as determined by biionic potentials. (B) Estimation of pore size. The permeability of WT and D65N claudin-2 to organic cations (PX) was calculated from biionic potentials. Curves were fit by nonlinear regression to a Renkin equation with pore diameter, D, of 6.5 ± 0.3 Å (WT) and 5.8 ± 0.3 Å (D65N). MA, methylamine; EA, ethylamine; TMA, tetramethylammonium. (Inset) Data are replotted as √(PX/PNa) versus diameter to show linear fit. (C) Conductance trace showing the effect of acidification of the apical compartment to pH 4.0 on cells expressing WT claudin-2. (D) Summary of effect of acidification to pH 4.0 on conductance and PNa of WT claudin-2. (E) Effect of acidification to different pH on conductance, G, relative to that at pH 7. The curve shows the fit to a Hill equation, G = Gmax{(Ka + α[H+]n)/(Ka + [H+]n)}, where Gmax is the maximum conductance, Ka is the equilibrium constant, n is the Hill coefficient, and α is a proportionality constant. Best-fit values were n = 1.0 and pKa = 4.9 ± 0.1.
Figure 8.
Figure 8.
Characterization of MDCK I TetOff cell lines expressing charge-neutralizing mutants of claudin-2. (A) Immunoblot of claudin-2 expression in clones stably transfected with WT claudin-2 (WT), the indicated individual claudin-2 mutants, and a TM (TM = E53Q, D65N, and D76N) grown in the presence (+) or absence (−) of doxycycline (Dox), using antibodies to the indicated claudin isoforms. (B) Confocal images showing immunofluorescence localization of mutant claudin-2 protein in Dox− cells. (C) Effect of claudin-2 induction on expression of other tight junction membrane proteins. Cell lysates were immunoblotted with antibodies against the indicated claudin isoforms or occludin. (A and C) White lines indicate that intervening lanes have been spliced out.
Figure 9.
Figure 9.
Effect of charge-neutralizing mutations in the first extracellular domain on claudin-2 permeability. (A and B) Conductance and Na+ and Cl permeability of claudin-2 WT (WT) and mutants (TM = E53Q, D65N, and D76N). *, P < 0.001 compared with WT. (C) Arrhenius plot showing the relationship between conductance (log scale) and the reciprocal of the absolute temperature (T). (D) Activation energies (Ea) for conductance and permeability to Na+ and Li+, determined by linear regression from Arrhenius plots. *, P < 0.05; **, P < 0.01.
Figure 10.
Figure 10.
Evidence that aspartate-65 is an electrostatic cation interaction site. (A) Effect of D65N on permeability to Ca2+, as measured by radiotracer flux assay. (B) Effect of acidification to pH 4.0 on PNa of WT and mutant claudin-2. (C and D) Absolute and relative permeabilities to alkali metal cations of WT and mutant claudin-2 (see B for explanation of symbols). (E) Relative permeability to Li+ (PLi/PNa) of WT or D65N claudin-2 at pH 7.0 or 4. *, P < 0.01; **, P < 0.001 compared with WT at pH 7.0 (n = 6–9).
Figure 11.
Figure 11.
Brownian dynamics modeling of the claudin-2 pore. (A) Model of the WT claudin-2 pore. E53 and D76 are positioned near the pore entrances. Residue D65 is placed in the middle and represented by a charged sphere characterized by its size RD, charge qD, and the distance between the pore centerline and the sphere center, RC. (B) Current–voltage relationship obtained in symmetric 150 mM NaCl. Open symbols with error bars represent numerical simulation data. (C) Conductance–concentration profile obtained from simulations with symmetrical NaCl concentrations up to 450 nM. Data points within the experimental range (up to a Na+ activity of 113 mM or concentration of 150 mM) are fit by a dashed line. The solid line shows a curve fit of the entire dataset to the Michaelis-Menten equation: G = Gmax/(1 + Nas/[Na]), where Gmax = 450 pS and Nas = 600 mM. (D) Alkali metal cation selectivity (displayed as permeability relative to that of Na+) determined by the biionic potentials obtained in our numerical simulations (shown as filled squares with error bars). For comparison, the experimental values (from Fig. 7 A) are shown as open circles.
Figure 12.
Figure 12.
Alignment of the amino acid sequences of the predicted first extracellular domain of the known mouse claudin isoforms using Clustal-W. Acidic residues are shaded pink, and basic residues are shaded blue. Residues that align at the homologous position to amino acids 65 and 66 of claudin-2 are indicated by arrows.

References

    1. Alexandre, M.D., Q. Lu, and Y.H. Chen. 2005. Overexpression of claudin-7 decreases the paracellular Cl- conductance and increases the paracellular Na+ conductance in LLC-PK1 cells. J. Cell Sci. 118:2683–2693. - PubMed
    1. Amasheh, S., N. Meiri, A.H. Gitter, T. Schoneberg, J. Mankertz, J.D. Schulzke, and M. Fromm. 2002. Claudin-2 expression induces cation-selective channels in tight junctions of epithelial cells. J. Cell Sci. 115:4969–4976. - PubMed
    1. Andersen, O.S., and M. Fuchs. 1975. Potential energy barriers to ion transport within lipid bilayers. Biophys. J. 15:795–830. - PMC - PubMed
    1. Angelow, S., K.J. Kim, and A.S. Yu. 2006. Claudin-8 modulates paracellular permeability to acidic and basic ions in MDCK II cells. J. Physiol. 571:15–26. - PMC - PubMed
    1. Angelow, S., R. El-Husseini, S.A. Kanzawa, and A.S. Yu. 2007. a. Renal localization and function of the tight junction protein, claudin-19. Am. J. Physiol. Renal Physiol. 293:F166–F177. - PubMed

Publication types

MeSH terms