. 2008;3(12):e4053.
doi: 10.1371/journal.pone.0004053. Epub 2008 Dec 30.

A recalibrated molecular clock and independent origins for the cholera pandemic clones

Affiliations

A recalibrated molecular clock and independent origins for the cholera pandemic clones

Lu Feng et al. PLoS One. 2008.

Abstract

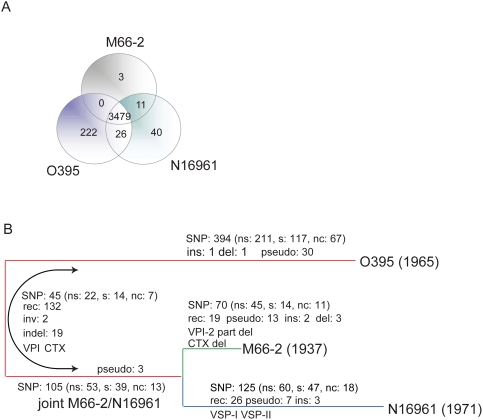
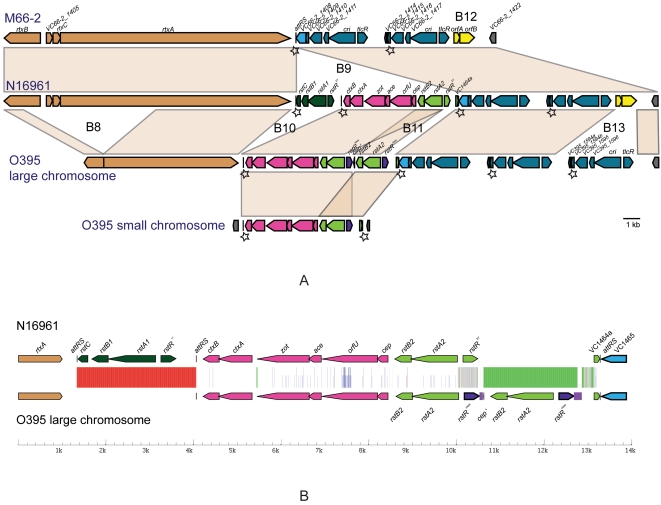
Cholera, caused by Vibrio cholerae, erupted globally from South Asia in 7 pandemics, but there were also local outbreaks between the 6(th) (1899-1923) and 7(th) (1961-present) pandemics. All the above are serotype O1, whereas environmental or invertebrate isolates are antigenically diverse. The pre 7th pandemic isolates mentioned above, and other minor pathogenic clones, are related to the 7(th) pandemic clone, while the 6(th) pandemic clone is in the same lineage but more distantly related, and non-pathogenic isolates show no clonal structure. To understand the origins and relationships of the pandemic clones, we sequenced the genomes of a 1937 prepandemic strain and a 6(th) pandemic isolate, and compared them with the published 7(th) pandemic genome. We distinguished mutational and recombinational events, and allocated these and other events, to specific branches in the evolutionary tree. There were more mutational than recombinational events, but more genes, and 44 times more base pairs, changed by recombination. We used the mutational single-nucleotide polymorphisms and known isolation dates of the prepandemic and 7(th) pandemic isolates to estimate the mutation rate, and found it to be 100 fold higher than usually assumed. We then used this to estimate the divergence date of the 6(th) and 7(th) pandemic clones to be about 1880. While there is a large margin of error, this is far more realistic than the 10,000-50,000 years ago estimated using the usual assumptions. We conclude that the 2 pandemic clones gained pandemic potential independently, and overall there were 29 insertions or deletions of one or more genes. There were also substantial changes in the major integron, attributed to gain of individual cassettes including copying from within, or loss of blocks of cassettes. The approaches used open up new avenues for analysing the origin and history of other important pathogens.


Conflict of interest statement

Competing Interests: The authors have declared that no competing interests exist.

Figures

Figure 1
Figure 1. Relationships of M66-2, 6th and 7th pandemic clones, and other closely related toxigenic strains based on 26 house keeping genes (Salim et al. 2005).
The relationships of the strains are identical to those in Figure 2 of Salim et al. (2005) but the tree is presented as phylogram as commonly used for easy interpretation. The mutational (m) and recombinational (r) changes with gene names are marked on the branches. The 3 strains compared in this study are highlighted in light green colour. The branch lengths are not drawn to scale.
Figure 2
Figure 2. Distribution of genes among the 3 genomes and evolutionary events during the divergence of the 3 strains.
(A) Venn diagram showing number of genes unique to each genome or present in 2 or 3 genomes. Genes in the major integron, pseudogenes and their homologs excluded. (B) Relationships of M66-2, N16961 and O395. Branch lengths are proportional to the estimated time frames for divergence, which were based on synonymous mutations as described in the text. All events were allocated to specific lineages if possible, or to the O/NM divergence as shown (details in Supporting Text S1). Note that numbers of SNPs have been adjusted for the proportion of the genome covered after allowing for recombination segments (see Supporting Methods Text S1 for details). ns, non-synonymous; s, synonymous; nc, non-coding region; rec, recombination event; inv, inversion; ins, large insertion; del, large deletion; indel, insertion or deletion in one of 2 lineages; pseudo, pseudogenes.
Figure 3
Figure 3. Alignment of the whole genomes and inverted regions.
(A) Alignment of the O395, N16961 and M66-2 large (left) and small (right) chromosomes. (B) Alignment of the inverted regions of O395 relative to N16961 /M66-2 (not to scale). Both inversions are bracketed by inverted repeats comprising ISVch4 elements (small chromosomes) and rrn operons h and b (large chromosomes). The inverted repeats marked by orange bold line, align to both copies in the other strain, as shown in the figure by red bands and light blue bands connecting them to the proximal and distal homologues respectively. The inversions are assumed to have arisen by homologous recombination between these repeats, but sequence comparisons did not have any indication of recombination sites and so it is not possible to determine precisely where the break points should be.
Figure 4
Figure 4. Alignment of the of M66-2, N16961 and O395 genomes.
Top: View to show gene annotation. Below: Zoom-out view to include two 100 kb segments to show the alignment of 3 genomes. At top of each alignment is annotation of M66-2, and below 3 bands indicating how M66-2, N16961 and O395 differ from the other genomes. Map positions in kb given below each genome. Large indels shown as blocks of colour (green shows deletion, red shows insertion) named as in Table S5, and gene names or locus tags are also shown for the indels not in M66-2. SNPs of various classes indicated as shown in the key, and clusters of SNPs proposed to have entered the lineage by recombination indicated by orange bars as shown in the key. Full genome alignments are shown in Figure S1.
Figure 5
Figure 5. Homologies among cassettes of the integrons of M66-2, N16961 and O395.
(A) Comparison showing major blocks of cassettes. (B) Alignment with gaps to properly align homologous cassettes for blocks F to R, thought to have been in the common ancestor as shown in row 3: gaps represent segments lost in that strain. Lines with arrows below represent the proposed copying of cassettes. Upward pointing arrows indicate cassette proposed to have been copied by IntI from a downstream cassette. Downward pointing arrows indicate proposed donor cassettes with some no longer present in that strain. Details are shown in Figure S4.
Figure 6
Figure 6. A.
Comparison of the CTX phage regions in the 3 genomes M66-2, N16961 and O395. The 6 indels (B8–B13) in this region are also shown and discussed in Supporting Discussion Text S1. The CTX phage on the small chromosome in O395 is also shown for comparison. The genes are named for M66-2, and the genes of the CTX phage missing in M66-2 are named in N16961. The colour codes are; orange, rtx toxin region; black, the 17 bp attRS sites; red, core region of the CTX phage; dark green, the RS1 (rstC, rstB, rstA, rstR) region of the CTX phage of N16961; light green, the RS2 (rstB, rstA, rstR) region of the CTX phage of N16961; purple, the divergent rstR gene of RS2 of O365; light blue, genes not related to CTX; dark blue, the 5-gene toxin-linked cryptic (TLC) element–2–3 copies in each strain. The first and second copies of TLC differ between N16961 and O395 by 2 and 3 SNPs respectively. Only cri and tlcR are named and the others given locus tags as in N16961; yellow, IS3. B. Plot of base changes in the CTX phage genomes of O395 and N16961. The base changes in the homologous region of the CTX phage genome between O395 and N16961 were plotted using the same approach as in Figure 4. Except that red and green are specifically for presence and absence respectively in N16961 relative to O395. The differences in rstR are too numerous to be shown. The residual fragment of the rtxA gene upstream of the CTX phage in O395 differs by 1 base from the homologue in N16961.

References

    1. Blake PA. Historical perspectives on pandemic cholera. In: Wachsmuth IK, Blake PA, Olsvik O, editors. Vibrio cholerae and cholera, molecular to global perspectives. Washington: ASM Press; 1994. pp. 293–295.
    1. Mukerjee S. Problems of Cholera (El Tor). Am J Trop Med Hyg. 1963;12:388–392. - PubMed
    1. Salim A, Lan R, Reeves PR. Vibrio cholerae pathogenic clones. Emerg Infect Dis. 2005;11:1758–1760. - PMC - PubMed
    1. Reeves PR, Lan R. Cholera in the 1990s. Br Med Bull. 1998;54:611–623. - PubMed
    1. Guidolin A, Manning PA. Genetics of Vibrio cholerae and its bacteriophages. Microbiol Rev. 1987;51:285–298. - PMC - PubMed

Publication types