. 2009 Jan;15(1):24-30.
doi: 10.3201/eid1501.080299.

Enhanced hygiene measures and norovirus transmission during an outbreak

Affiliations

Enhanced hygiene measures and norovirus transmission during an outbreak

Janneke C M Heijne et al. Emerg Infect Dis. 2009 Jan.

Abstract

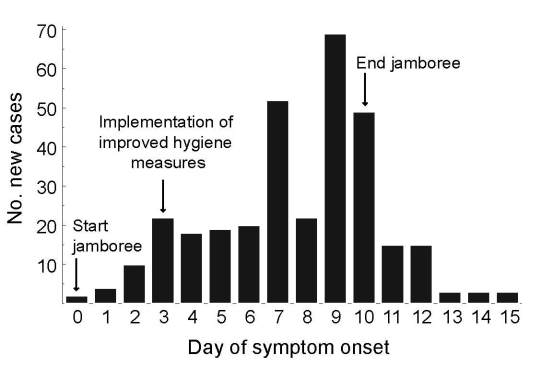
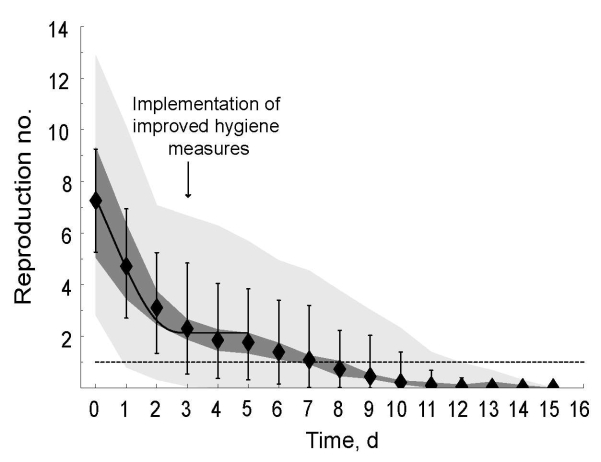
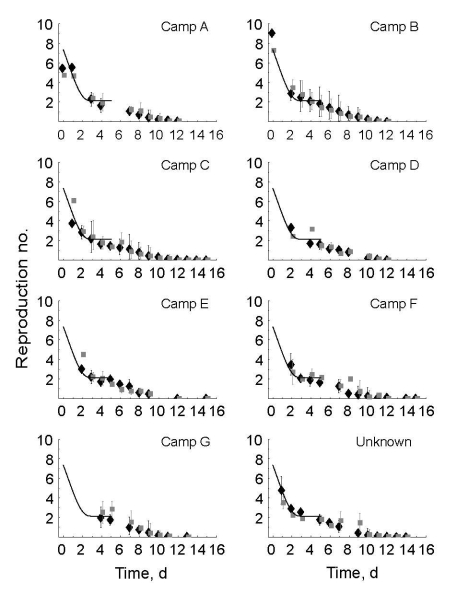
Control of norovirus outbreaks relies on enhanced hygiene measures, such as handwashing, surface cleaning, using disposable paper towels, and using separate toilets for sick and well persons. However, little is known about their effectiveness in limiting further spread of norovirus infections. We analyzed norovirus outbreaks in 7 camps at an international scouting jamboree in the Netherlands during 2004. Implementation of hygiene measures coincided with an 84.8% (95% predictive interval 81.2%-86.6%) reduction in reproduction number. This reduction was unexpectedly large but still below the reduction needed to contain a norovirus outbreak. Even more stringent control measures are required to break the chain of transmission of norovirus.


Figures

Figure 1
Figure 1
Epidemic curve of an outbreak of norovirus at an international scout jamboree in the Netherlands, starting July 26, 2004 (day 0).
Figure 2
Figure 2
Generation time distribution for norovirus infections. Generation time is the time between onset of symptoms in successive case-patients. The histogram gives the relative frequency in norovirus outbreaks in Sweden in 1999 (25); the black line indicates the maximum-likelihood fit of the gamma distribution.
Figure 3
Figure 3
Time course of the reproduction number for norovirus at an international scout jamboree, starting July 26, 2004 (day 0), in the Netherlands. Black diamonds show the mean value for the reproduction number over all sampled transmission matrices; vertical lines, mean minimum and maximum values for the reproduction number over all sampled transmission matrices. The dark gray area shows the uncertainty range (0.025 and 0.975 quantiles) in the mean reproduction number; light gray are, the uncertainty range (0.025 and 0.975 quantiles) of the maximum and minimum estimates of the reproduction number. The solid black line represents the fitted time course of reproduction numbers if decrease in the mean reproduction number results from an instantaneous decline in transmission when enhanced hygiene measures began; dashed line, the threshold value of 1, below which the outbreak was controlled.
Figure 4
Figure 4
Time course of the reproduction number for norovirus for 7 camps of an international scout jamboree. Black diamonds show the mean value of the reproduction number without additional information about population structure and genotypes. Gray boxes show the mean value of the reproduction number when additional information about population structure and genotypes is used. The vertical lines show the mean minimum and maximum reproduction number over all sampled transmission matrices. The solid black line represents the time course of reproduction numbers if decrease in the mean reproduction number results from an instantaneous decline in transmission when enhanced hygiene measures begin. The camps are in order of the day of symptom onset of the first case-patient. Top panels indicate first introduction, bottom panels the last introduction.

References

    1. Mead PS, Slutsker L, Dietz V, McCaig LF, Bresee JS, Shapiro C, et al. Food-related illness and death in the United States. Emerg Infect Dis. 1999;5:607–25. - PMC - PubMed
    1. Estes MK, Prasad BV, Atmar RL. Noroviruses everywhere: has something changed? Curr Opin Infect Dis. 2006;19:467–74. 10.1097/01.qco.0000244053.69253.3d - DOI - PubMed
    1. Kroneman A, Vennema H, Harris J, Reuter G, von Bonsdorff CH, Hedlund KO, et al. Increase in norovirus activity reported in Europe. Euro Surveill 2006;11(50):3093 [cited 17 Nov 2008]. Available from http://www.eurosurveillance.org/ViewArticle.aspx?ArticleId=3093 - PubMed
    1. van Duynhoven YT, de Jager CM, Kortbeek LM, Vennema H, Koopmans MP, van Leusden F, et al. A one-year intensified study of outbreaks of gastroenteritis in the Netherlands. Epidemiol Infect. 2005;133:9–21. 10.1017/S0950268804002936 - DOI - PMC - PubMed
    1. Duizer E, Koopmans M. Tracking foodborne viruses: lessons from noroviruses. In: Motarjemi Y, Adams M, editors. Emerging foodborne pathogens. Boca Raton (FL): CRC Press, 2006. p. 77–110.

MeSH terms