

3D morphology of the human hepatic ferritin mineral core: new evidence for a subunit structure revealed by single particle analysis of HAADF-STEM images
- PMID: 19116170
- PMCID: PMC2832756
- DOI: 10.1016/j.jsb.2008.12.001
3D morphology of the human hepatic ferritin mineral core: new evidence for a subunit structure revealed by single particle analysis of HAADF-STEM images
Abstract
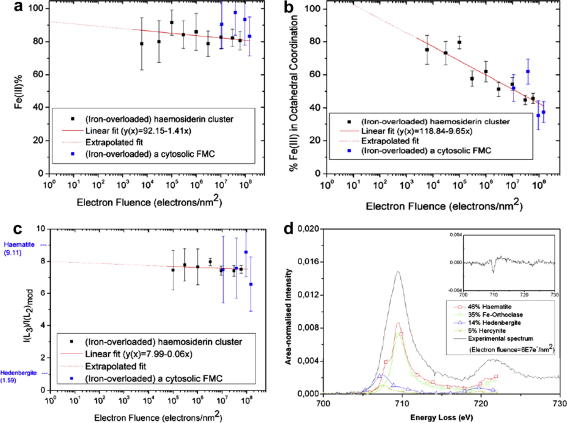
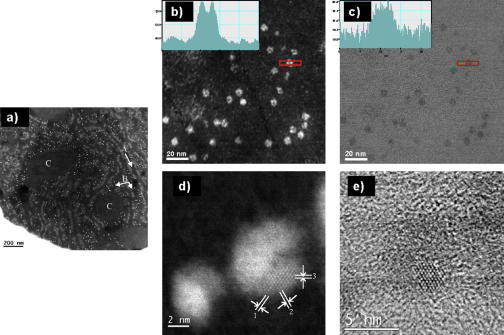
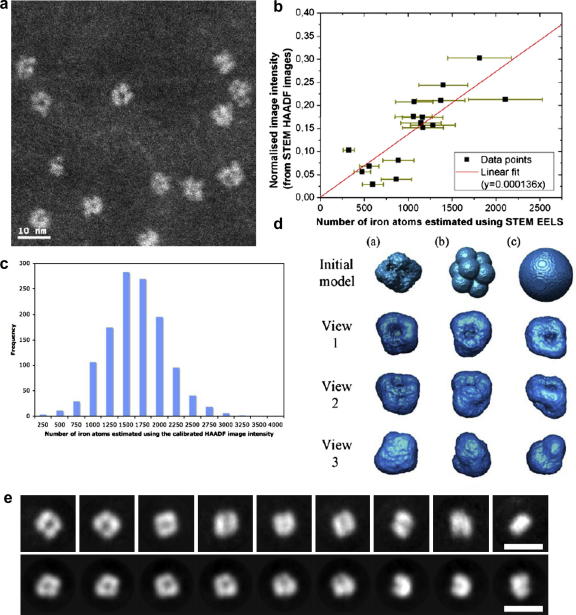
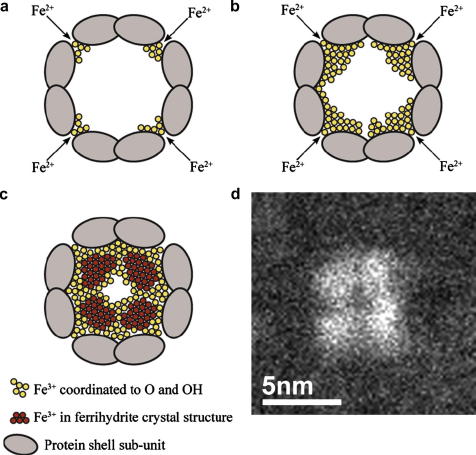
Ferritin, the major iron storage protein, has dual functions; it sequesters redox activity of intracellular iron and facilitates iron turn-over. Here we present high angle annular dark field (HAADF) images from individual hepatic ferritin cores within tissue sections, these images were obtained using spherical aberration corrected scanning transmission electron microscopy (STEM) under controlled electron fluence. HAADF images of the cores suggest a cubic morphology and a polycrystalline (ferrihydrite) subunit structure that is not evident in equivalent bright field images. By calibrating contrast levels in the HAADF images using quantitative electron energy loss spectroscopy, we have estimated the absolute iron content in any one core, and produced a three dimensional reconstruction of the average core morphology. The core is composed of up to eight subunits, consistent with the eight channels in the protein shell that deliver iron to the central cavity. We find no evidence of a crystallographic orientation relationship between core subunits. Our results confirm that the ferritin protein shell acts as a template for core morphology and within the core, small (approximately 2 nm), surface-disordered ferrihydrite subunits connect to leave a low density centre and a high surface area that would allow rapid turn-over of iron in biological systems.
Figures
Similar articles
-
Effect of Phosphate and Ferritin Subunit Composition on the Kinetics, Structure, and Reactivity of the Iron Core in Human Homo- and Heteropolymer Ferritins.Biochemistry. 2022 Oct 4;61(19):2106-2117. doi: 10.1021/acs.biochem.2c00354. Epub 2022 Sep 13. Biochemistry. 2022. PMID: 36099002 Free PMC article.
-
Electron beam damage studies of synthetic 6-line ferrihydrite and ferritin molecule cores within a human liver biopsy.Micron. 2006;37(5):403-11. doi: 10.1016/j.micron.2005.12.009. Epub 2006 Jan 19. Micron. 2006. PMID: 16466926
-
Electron nanodiffraction and high-resolution electron microscopy studies of the structure and composition of physiological and pathological ferritin.J Struct Biol. 2004 Aug;147(2):166-78. doi: 10.1016/j.jsb.2004.03.001. J Struct Biol. 2004. PMID: 15193645
-
Mineralization in ferritin: an efficient means of iron storage.J Struct Biol. 1999 Jun 30;126(3):182-94. doi: 10.1006/jsbi.1999.4118. J Struct Biol. 1999. PMID: 10441528 Review.
-
The ferritins: molecular properties, iron storage function and cellular regulation.Biochim Biophys Acta. 1996 Jul 31;1275(3):161-203. doi: 10.1016/0005-2728(96)00022-9. Biochim Biophys Acta. 1996. PMID: 8695634 Review.
Cited by
-
Development and application of STEM for the biological sciences.Ultramicroscopy. 2012 Dec;123:38-49. doi: 10.1016/j.ultramic.2012.04.005. Epub 2012 May 18. Ultramicroscopy. 2012. PMID: 22749213 Free PMC article. Review.
-
Electromagnetic Regulation of Cell Activity.Cold Spring Harb Perspect Med. 2019 May 1;9(5):a034322. doi: 10.1101/cshperspect.a034322. Cold Spring Harb Perspect Med. 2019. PMID: 30249601 Free PMC article. Review.
-
Morphological difference of Escherichia coli non-heme ferritin iron cores reconstituted in the presence and absence of inorganic phosphate.J Biol Inorg Chem. 2022 Sep;27(6):583-594. doi: 10.1007/s00775-022-01952-5. Epub 2022 Aug 20. J Biol Inorg Chem. 2022. PMID: 35986810
-
Indication of Strongly Correlated Electron Transport and Mott Insulator in Disordered Multilayer Ferritin Structures (DMFS).Materials (Basel). 2021 Aug 12;14(16):4527. doi: 10.3390/ma14164527. Materials (Basel). 2021. PMID: 34443050 Free PMC article.
-
Ferritin Single-Electron Transistor.J Phys Chem B. 2024 Jul 4;128(26):6387-6393. doi: 10.1021/acs.jpcb.4c01937. Epub 2024 Jun 25. J Phys Chem B. 2024. PMID: 38916107 Free PMC article.
References
-
- Barton J.C., Bertoli L.F. Hemochromatosis: the genetic disorder of the twenty-first century. Nat. Med. 1996;2:394. - PubMed
-
- Bessis M., Breton-Gorius J. Aspects de la molécule de ferritine et d’apoferritine au microscope électronique. C R Hebdomadaires Seances Acad. Sci. 1960;250:1360–1362. - PubMed
-
- Bleloch A., Lupini A.R. Imaging at the picoscale. Mater. Today. 2004:42–48.
-
- Bou-Abdallah F., Biasiotto G., Arosio P., Chasteen N.D. The putative “nucleation site” in human H-chain ferritin is not required for mineralization of the iron core. Biochemistry. 2004;43:4332–4337. - PubMed
Publication types
MeSH terms
Substances
Grants and funding
LinkOut - more resources
Full Text Sources
