. 2009 Apr;166(1):1-7.
doi: 10.1016/j.jsb.2008.11.005. Epub 2008 Dec 10.

3D imaging of mammalian cells with ion-abrasion scanning electron microscopy

Affiliations

3D imaging of mammalian cells with ion-abrasion scanning electron microscopy

Jurgen A W Heymann et al. J Struct Biol. 2009 Apr.

Abstract

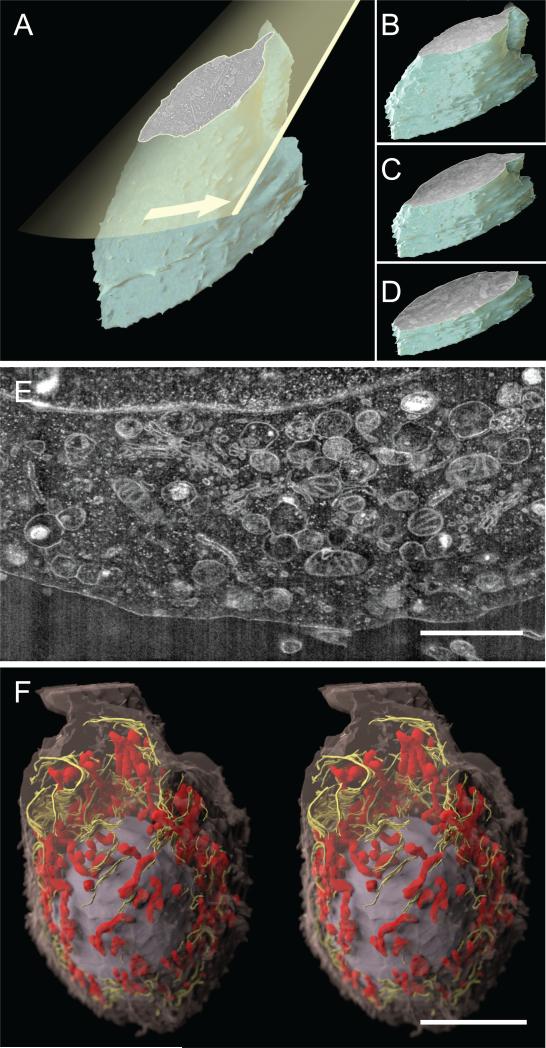
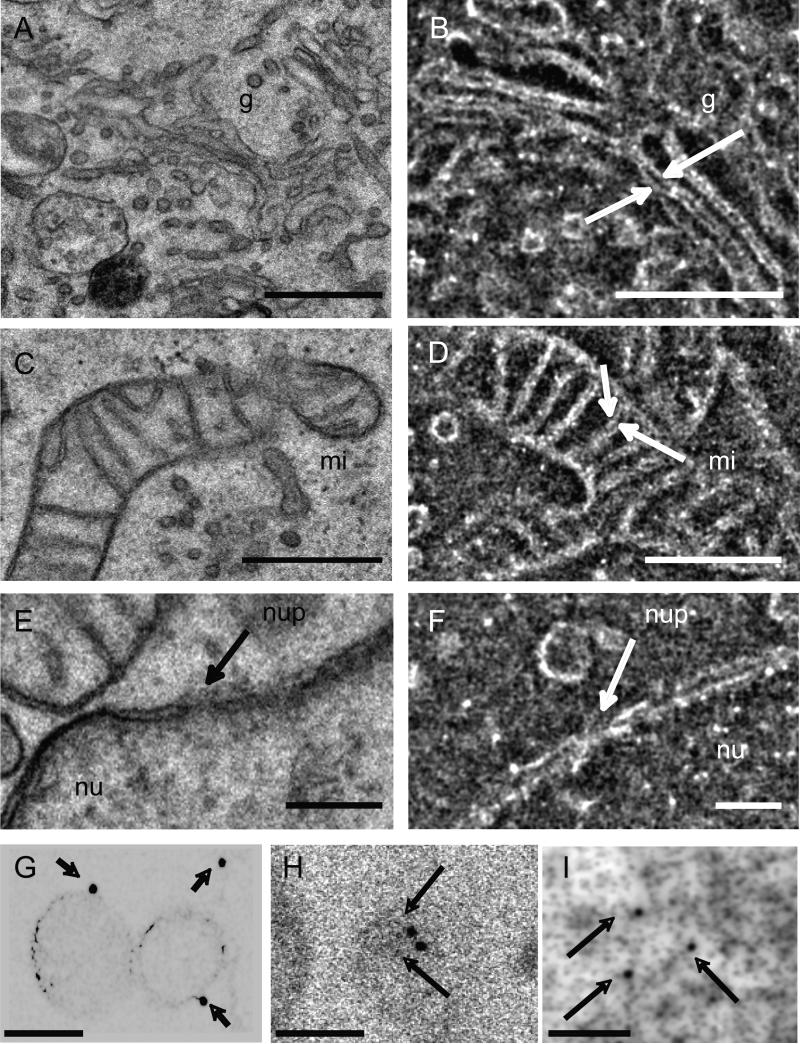
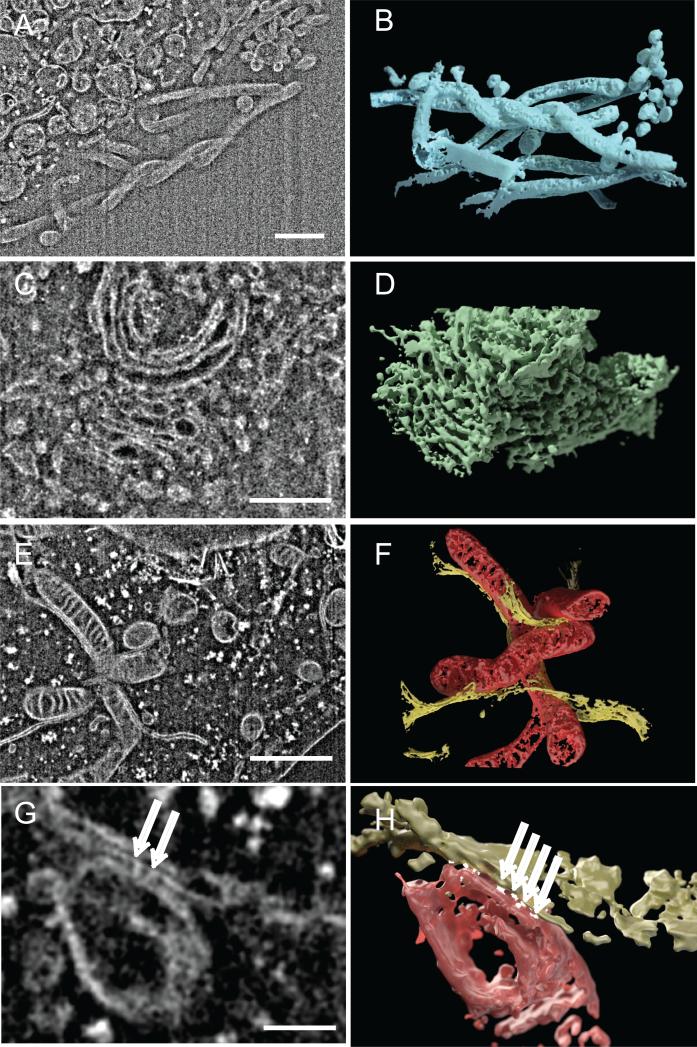
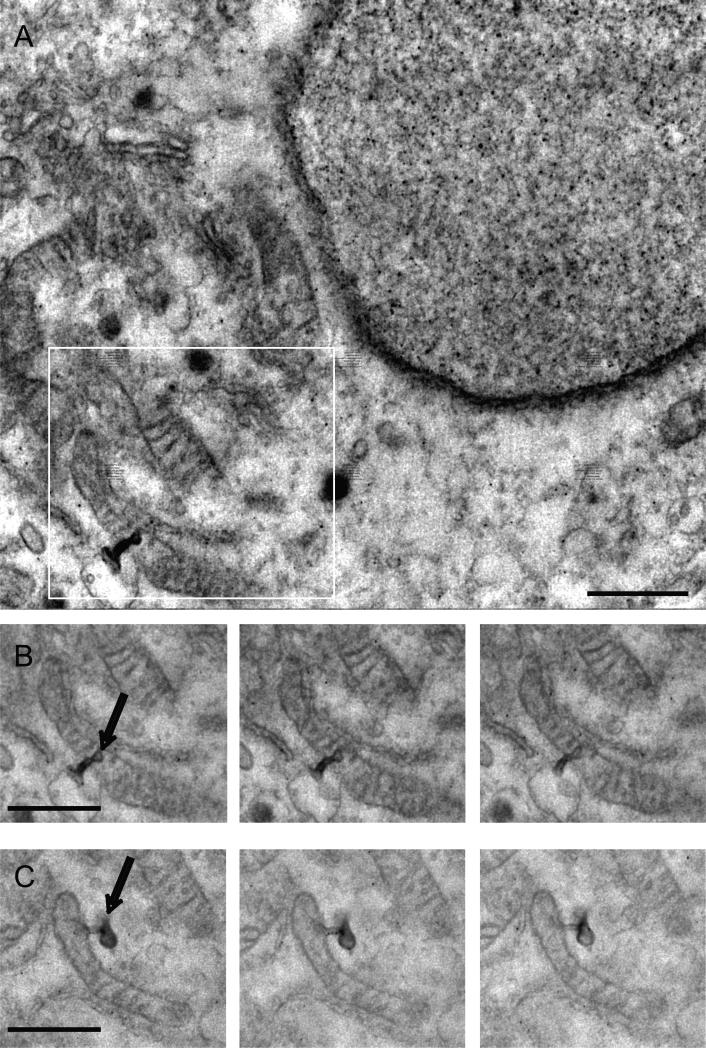
Understanding the hierarchical organization of molecules and organelles within the interior of large eukaryotic cells is a challenge of fundamental interest in cell biology. We are using ion-abrasion scanning electron microscopy (IA-SEM) to visualize this hierarchical organization in an approach that combines focused ion-beam milling with scanning electron microscopy. Here, we extend our previous studies on imaging yeast cells to image subcellular architecture in human melanoma cells and melanocytes at resolutions as high as approximately 6 and approximately 20 nm in the directions parallel and perpendicular, respectively, to the direction of ion-beam milling. The 3D images demonstrate the striking spatial relationships between specific organelles such as mitochondria and membranes of the endoplasmic reticulum, and the distribution of unique cellular components such as melanosomes. We also show that 10nm-sized gold particles and quantum dot particles with 7 nm-sized cores can be detected in single cross-sectional images. IA-SEM is thus a useful tool for imaging large mammalian cells in their entirety at resolutions in the nanometer range.


Figures

Figure 1
Figure 1
Whole cell imaging and organelle visualization using IA-SEM. (A) Principle of 3D imaging using a focused ion beam (yellow plane) to expose the interior of a cell or tissue specimen, which is then imaged using scanning electron microscopy. Iteration of these steps to progress through the cell volume results in a stack of 2D surface images (B–D) that can be combined to generate a 3D representation of the cell. (E) A cross-sectional image of cell interior obtained using IA-SEM illustrating 2D organellar arrangement. The membrane structures with the bright spots likely represent rough endoplasmic reticulum studded with ribosomes on the surface. (F) 3D image of an MNT-1 melanoma cell (~20 × 35 μm wide) obtained using a series of IA-SEM images (such as the one shown in 1E, see Movie S1 for actual data stack and Movie S2 for an animation of the rendering) and segmented to show the spatial arrangement of a selection of mitochondria (red), endoplasmic reticulum (yellow), and the nucleus (gray) relative to the cell envelope (magenta). Inter-image spacing in the stack is ~30 nm, and in-plane pixel size is ~12 nm. Scale bar in (E and F) are 2 and 10 μm long, respectively.
Figure 2
Figure 2
Image quality and detection of nanoparticle labels in IA-SEM images of MNT-1 melanoma cells. (A–F) Comparative analysis of information present in images of cell interior obtained using conventional TEM (A, C and E) with single slices (B, D and F) of similar regions obtained using IA-SEM at the same pixel size. Arrows indicate details in the membrane organization in mitochondria (mi), Golgi (g) and nuclear pore (nup) in the membrane of the nucleus (nu). (G–I) Detection of 15 nm gold, 10 nm gold conjugated to protein A or quantum dots with 7 nm-size cores (marked by arrows), respectively, in individual cross-sectional images from labeled MNT-1 cells. The 15 nm gold and quantum dot particles were taken up passively by the cells, while the protein A-conjugated gold was used to label antibodies specific to the melanoma antigen Pmel17 (Valencia et al., 2006) (see also Movie S3 for larger views of quantum dot-labeled cells). The images in (G–I) are shown with inverted contrast to highlight the detection of the gold and quantum dot particles. Inter-image spacing: 20 nm, in-plane pixel size 3.1 nm. Scale bars: (A–D) 0.5 μm, (E and F) 0.2 μm, (G, H and I) 100 nm.
Figure 3
Figure 3
Three-dimensional visualization of organelles in MNT-1 melanoma cells using IA-SEM. (A, C and E). Selected 2D images from an image stack obtained by IA-SEM that highlight filopodia (A), Golgi stack (C) and mitochondria with adjacent endoplasmic reticulum (ER) membrane (E). (B, D and F) Rendered 3D volumes derived from the stack of 2D images encompassing the filopodial, Golgi and mitochondrial/ER structures shown in (A, C and E), respectively. (G and H) Close-up view of mitochondria and endoplasmic reticulum bridged by punctate contact regions (shown in white), and indicated by arrows (G). Inter-image spacing: 20 nm, in-plane pixel size 3.1 nm. Scale bars are 1 μm in (A, C and E) and 100 nm in G.
Figure 4
Figure 4
Localization of membrane protrusions in mitochondrial outer membranes. A group of mitochondria was located in a melanoma cell that displayed membrane structures protruding from mitochondria (A). The black dots in the image represent quantum dots taken up by the cell that was used in this experiment. The boxed area is shown in (B) as a sequence of surface images collected in the process of imaging the cellular volume. (C) Another example of a mitochondrion with membrane protrusion found in the same volume. Inter-image spacing: 30 nm, in-plane pixel size 3.1 nm. Scale bar is 1 μm.
Figure 5
Figure 5
Detection of melanosome distribution in cultured human melanocytes. (A) Segmented 3D representation of image stack from a cultured melanocyte cell showing the position and distribution of melanosomes (in color) within the cell body (magenta) and outside the nucleus (purple). A single 2D image is shown below the 3D image. (B–D) Selected, serial 2D cross-sections of individual segmented melanosomes (indicated by colored arrows) from (A) showing differences in internal membrane organization and pigmentation. The melanosome in column (B) has the beginnings of internal membrane organization that is further advanced in the melanosome in column (C), and completed in the melanosome in column (D). Inter-image spacing: 30 nm, in-plane pixel size 6 nm. Scale bars are 0.5 μm in (B–D).

References

    1. Balaban RS. Modeling mitochondrial function. Am. J. Physiol. Cell Physiol. 2006;291:C1107–C1113. - PubMed
    1. Betzig E, Patterson GH, Sougrat R, Lindwasser OW, Olenych S, Bonifacino JS, Davidson MW, Lippincott-Schwartz J, Hess HF. Imaging intracellular fluorescent proteins at nanometer resolution. Science. 2006;313 - PubMed
    1. Birkedal R, Shiels HA, Vendelin M. Three-dimensional mitochondrial arrangement in ventricular myocytes: from chaos to order. Am. J. Physiol. Cell Physiol. 2006;291:C1148–C1158. - PubMed
    1. Csordas G, Renken C, Varnai P, Walter L, Weaver D, Buttle KF, Balla T, Mannella CA, Hajnoczky G. Structural and functional features and significance of the physical linkage between ER and mitochondria. J. Cell Biol. 2006;174 - PMC - PubMed
    1. Dell'Angelica EC. The building BLOC(k)s of lysosomes and related organelles. Curr. Opin. Cell Biol. 2004;16 - PubMed

LinkOut - more resources