

Combined optical imaging and mammography of the healthy breast: optical contrast derived from breast structure and compression
- PMID: 19116186
- PMCID: PMC2642986
- DOI: 10.1109/TMI.2008.925082
Combined optical imaging and mammography of the healthy breast: optical contrast derived from breast structure and compression
Abstract
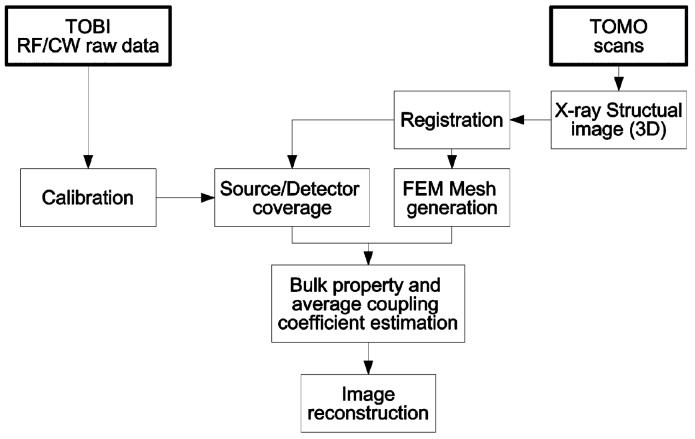
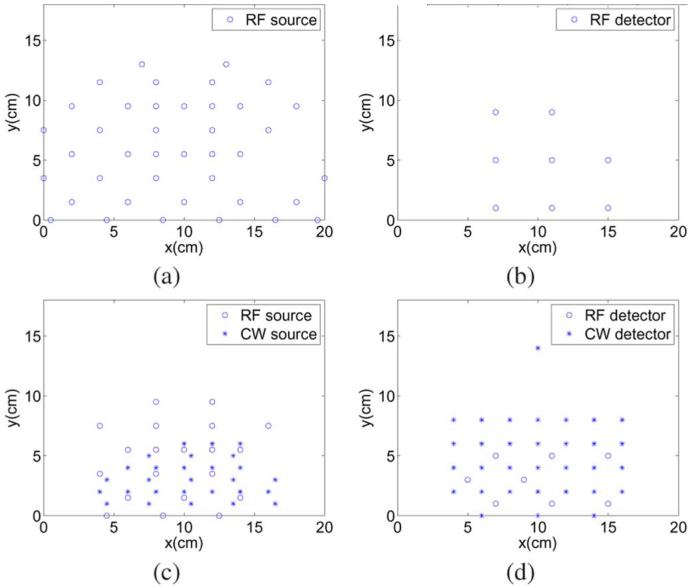
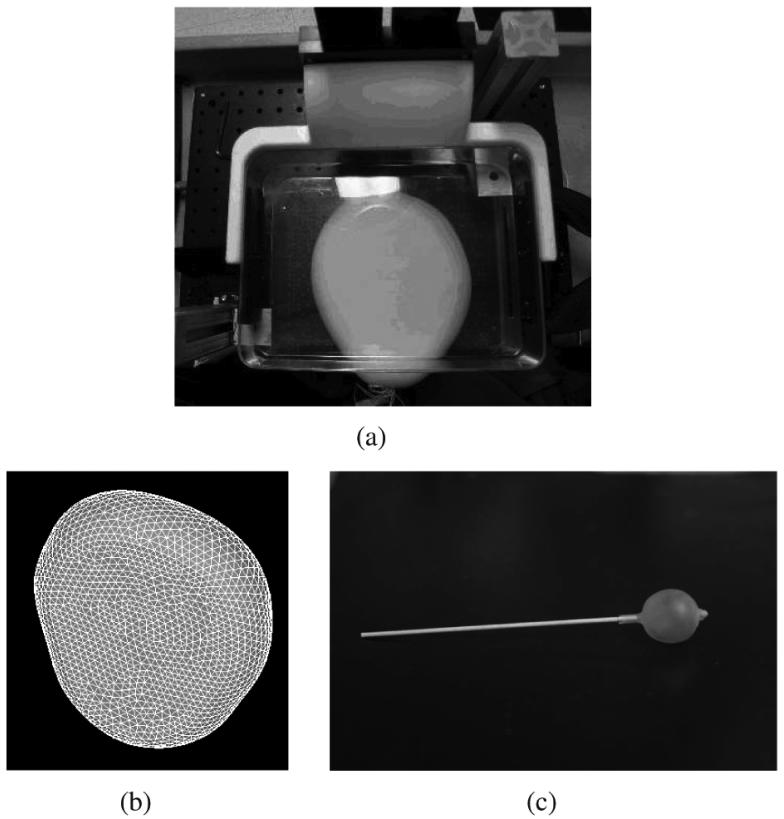
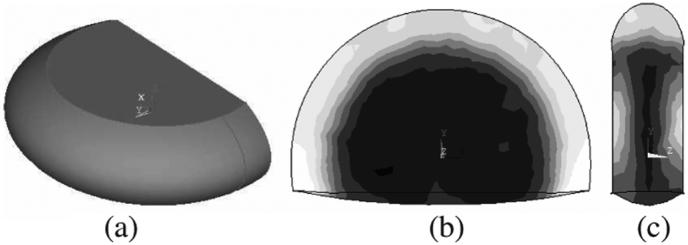
In this paper, we report new progress in developing the instrument and software platform of a combined X-ray mammography/diffuse optical breast imaging system. Particularly, we focus on system validation using a series of balloon phantom experiments and the optical image analysis of 49 healthy patients. Using the finite-element method for forward modeling and a regularized Gauss-Newton method for parameter reconstruction, we recovered the inclusions inside the phantom and the hemoglobin images of the human breasts. An enhanced coupling coefficient estimation scheme was also incorporated to improve the accuracy and robustness of the reconstructions. The recovered average total hemoglobin concentration (HbT) and oxygen saturation (SO2) from 68 breast measurements are 16.2 microm and 71%, respectively, where the HbT presents a linear trend with breast density. The low HbT value compared to literature is likely due to the associated mammographic compression. From the spatially co-registered optical/X-ray images, we can identify the chest-wall muscle, fatty tissue, and fibroglandular regions with an average HbT of 20.1+/-6.1 microm for fibroglandular tissue, 15.4+/-5.0 microm for adipose, and 22.2+/-7.3 microm for muscle tissue. The differences between fibroglandular tissue and the corresponding adipose tissue are significant (p < 0.0001). At the same time, we recognize that the optical images are influenced, to a certain extent, by mammographical compression. The optical images from a subset of patients show composite features from both tissue structure and pressure distribution. We present mechanical simulations which further confirm this hypothesis.
Figures


References
-
- American Cancer Society Cancer Prevention and Early Detection Facts & Figures 2007. 2007. [Online]. Available: http://www.cancer.org/doc-root/STT/content/STT_1x_Cancer_Prevention_and_....
-
- Tabar L, Yen M-F, Vitak H-HTCB, Smith RA, Duffy SW. Mammography service screening and mortality in breast cancer patients: 20-year follow-up before and after introduction of screening. Lancet. 2003;361:1405–1410. - PubMed
-
- Hebden JC, Arridge SR, Delpy DT. Optical imaging in medicine: I. Experimental techniques. Phys. Med. Biol. 1997;42:825–840. - PubMed
-
- Boas DA, Brooks DH, Miller EL, DiMarzio CA, Kilmer M, Gaudette RJ, Zhang Q. Imaging the body with diffuse optical tomography. IEEE Signal Process. Mag. 2001 Nov.18(6):57–75.
-
- Gibson AP, Hebden JC, Arridge SR. Recent advances in diffuse optical imaging. Phys. Med. Biol. 2005;50:R1–R43. - PubMed
Publication types
MeSH terms
Substances
Grants and funding
LinkOut - more resources
Full Text Sources
Other Literature Sources
Medical
