. 2009 Mar;23(3):360-72.
doi: 10.1210/me.2008-0188. Epub 2008 Dec 30.

Structure and activity of the human growth hormone receptor (hGHR) gene V2 promoter

Affiliations

Structure and activity of the human growth hormone receptor (hGHR) gene V2 promoter

Yuhong Wei et al. Mol Endocrinol. 2009 Mar.

Abstract

Human GH (hGH) has important effects on growth as well as carbohydrate, fat, and protein metabolism. These actions require the presence of normal levels of a functional hGH receptor (hGHR) on the surface of target cells. hGHR gene expression is characterized by the use of several 5'-noncoding exons and alternative splicing, resulting in the generation of multiple mRNA isoforms. The hGHR V2 transcript is predominant in most tissues, including human fat. However, factors regulating its ubiquitous expression have remained unidentified. The present study was aimed at characterizing the mechanisms regulating hGHR V2 transcription. Two major V2 transcriptional start sites were identified by primer extension assays. The V2 proximal promoter is TATA-less, with several characteristics of a housekeeping gene promoter. Transient transfection analyses of 2.6 kb of the 5'-flanking region of V2 confirmed its promoter activity in multiple primate cell lines. Similar promoter activity patterns were observed in human SGBS preadipocytes and mature adipocytes but with much higher V2 promoter activity in mature adipocytes, suggesting that changes in the availability of specific factors during adipocyte differentiation play a role in V2 promoter regulation. Serial deletion and mutation analyses revealed that transcription of hGHR V2 in different cell types, including adipocytes, is determined by a core promoter and distinct inhibitory and activation domains in the 5'-promoter region as well as within the V2 exon. Our data suggest that V2 transcription is the result of a complex interplay involving multiple factors, to ensure appropriate expression of hGHR in different hGH target cells.


Figures

Fig. 1.
Fig. 1.
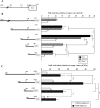
Mapping TSSs for hGHR V2. A, Representative autoradiograph of size-fractionated products of primer extension reactions carried out with a primer (V2PE) complementary to the V2 exon sequence and 20 μg total RNA extracted from three human cell lines and liver tissues. The sizes of two specific products (arrows) were determined by a concurrently electrophoresed 32P-labeled φX174 HinfI DNA ladder (lane M). Lane 1, HEK293 cells; lane 2, HEK293 cells transfected with V2(−2623/+331); lane 3, Huh7 cells; line 4, SGBS preadipocytes; lane 5, human fetal liver; lane 6, human adult liver. This assay was repeated three times with RNAs from at least two different cell pools and tissue samples. B, Positions corresponding to the two longest extended V2 5′-cDNA ends in our primer extension assays are shown in bold italic and underlined. The major (T, bold, boxed) and minor TSSs for ovine 1B are indicated by solid circles. The major (G, bold, underlined) and minor TSSs identified for bovine 1B are marked by open circles. The oligonucleotide primer (V2PE) used for primer extension is underlined by an arrow.
Fig. 2.
Fig. 2.
5′-Deletion analysis of the promoter activity of hGHR V2. We chose to designate the ovine 1B major TSS (T) as position +1 for our human V2 promoter construct numeration, because it represents the most 5′-cDNA end identified to date among V2 homologs (ovine 1B, bovine 1B, and mouse L2). A, A schematic diagram representing the first 362 nucleotides of the hGHR V2 exon and 2.623 kb of its 5′-flanking region. The numbering is relative to the designated major TSS (+1, indicated by arrow). 5′-Deletion promoter reporter constructs were prepared by inserting different portions of the 5′-flanking sequence of hGHR V2 into the promoterless luciferase plasmid pGL3-basic (pGL3b). B and C, These expression plasmids were transiently transfected into HEK293, CV-1 and Huh7 cells (B) and SGBS preadipocytes and mature adipocytes (C). Luciferase activity of the transfectants was normalized to β-galactosidase activity and then expressed as relative fold activation compared with the empty pGL3-b vector. The data are expressed as mean ± se; n = 3–9 experiments. *, P < 0.05; **, P < 0.01; ***, P < 0.001.
Fig. 3.
Fig. 3.
Presence of a portion of the V2 exon sequence enhances V2 promoter activity. Pairs of V2 promoter reporter constructs that contain the same 5′-upstream regions, but different downstream V2 exon lengths were transiently transfected into HEK293 cells or SGBS preadipocytes and compared for fold activation relative to the empty vector, pGL3b. The data are presented as mean ± se of n = 3–9 independent experiments. Significantly (*, P < 0.05; ***, P < 0.001) higher luciferase activity was noted for V2 reporter constructs that contain the longer 3′-downstream region sequences.
Fig. 4.
Fig. 4.
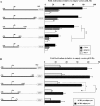
Characterization of the V2 exon regions required for achieving maximal V2 promoter activity. A and B, V2 promoter reporter constructs with progressive deletions of the 3′ V2 exon region were prepared and transfected into COS-1, HEK293, and Huh7 cells (A) and SGBS preadipocytes and mature adipocytes (B). Data are presented as mean ± se from n = 3–14 experiments. A significant decrease in promoter activity was observed from +162 to +103 for all five cell types. *, P < 0.05; **, P < 0.01; ***, P < 0.001. C, 3′-Deletion constructs covering the region from +162 to +103 were generated and transfected into HEK293 cells. Deletion of the region from +162 to +125 in the V2 exon caused the reporter activity to decrease significantly (***, P < 0.001). Data are expressed as mean ± se of n = 10 independent experiments. D, A double-stranded oligonucleotide probe containing the +123 to +144 sequence was end-labeled with [γ-32P]ATP and incubated with nuclear extracts prepared from HEK293 cells for EMSA. For oligonucleotide competition experiments, a 100-fold (lane 3) or a 200-fold (lane 4) excess of unlabeled probe was added before the addition of the labeled probe. The three specific DNA-protein complexes are indicated by arrows.
Fig. 4.
Fig. 4.
Characterization of the V2 exon regions required for achieving maximal V2 promoter activity. A and B, V2 promoter reporter constructs with progressive deletions of the 3′ V2 exon region were prepared and transfected into COS-1, HEK293, and Huh7 cells (A) and SGBS preadipocytes and mature adipocytes (B). Data are presented as mean ± se from n = 3–14 experiments. A significant decrease in promoter activity was observed from +162 to +103 for all five cell types. *, P < 0.05; **, P < 0.01; ***, P < 0.001. C, 3′-Deletion constructs covering the region from +162 to +103 were generated and transfected into HEK293 cells. Deletion of the region from +162 to +125 in the V2 exon caused the reporter activity to decrease significantly (***, P < 0.001). Data are expressed as mean ± se of n = 10 independent experiments. D, A double-stranded oligonucleotide probe containing the +123 to +144 sequence was end-labeled with [γ-32P]ATP and incubated with nuclear extracts prepared from HEK293 cells for EMSA. For oligonucleotide competition experiments, a 100-fold (lane 3) or a 200-fold (lane 4) excess of unlabeled probe was added before the addition of the labeled probe. The three specific DNA-protein complexes are indicated by arrows.
Fig. 5.
Fig. 5.
Identification of the core promoter for V2 basal transcription. Using the reporter construct V2(−211/+71) as a primary template, which contains the proximal promoter region but is not influenced by the downstream exon activation region, a set of further 5′- and 3′-deletion constructs were tested in both HEK293 cells and SGBS preadipocytes to define the minimal promoter region required for initiation of V2 transcription. Data are presented as mean ± se of n = 3–9 independent experiments. ***, P < 0.001 for the comparison of V2(−29/+71) with V2(+11/+71) and V2(−211/−25) in HEK293 cells; ###, P < 0.001 for the comparison in SGBS cells.
Fig. 6.
Fig. 6.
Schematic representation of the hGHR V2 exon and its 5′-upstream promoter. This diagram shows the hGHR V2 and its promoter region spanning from 720 bp upstream to 362 bp downstream of the designated TSS (+1), with the identified proximal promoter, core promoter, and activation as well as inhibitory domains. No TATA box was found within the V2 promoter region, whereas an INR-like element surrounds the TSS (+1). Putative cis-elements, including a CCAAT box, CHOP, and c- Ets1 binding sites, were found within a 40-bp region approximately 50 bp upstream of the TSS. Two putative Hes1 binding sites are present within the V2 exon as well as putative binding sites for Sp, SREBP, ZBP-89, and Egr-1 that are located as a cluster within an approximately 20-bp region.
Fig. 7.
Fig. 7.
Impact of important potential binding motifs within the core promoter on V2 basal transcription. A, The reporter construct V2(−29/+71), which includes only the core promoter region, was tested in HEK293 cells. Activity of the wild-type construct was compared with constructs containing mutations in the INR-like or putative Sp elements. The consensus sequences for the INR and Sp elements are provided at the top and mutated sequences are indicated by italic uppercase. Arrow indicates the major TSS (+1). Horizontal bars demonstrate activities of mutated constructs relative to wild type, which is arbitrarily set as 100%. Data are expressed as mean ± se of n = 4 separate assays. **, P < 0.01; ***, P < 0.001. B, Mutations of the INR-like, Sp, or CCAAT box elements were introduced into the larger promoter construct V2(−211/+362), which contains both the core promoter and upstream as well as downstream regulatory elements. Bar graphs on the right demonstrate activities of the mutated constructs in HEK293 cells relative to the wild-type vector, arbitrarily set at 100%. Data are presented as mean ± se of n = 6 experiments. ***, P < 0.001.

Similar articles

Cited by

References

    1. Perry JK, Emerald BS, Mertani HC, Lobie PE2006. The oncogenic potential of growth hormone. Growth Horm IGF Res 16:277–289 - PubMed
    1. Waters MJ, Shang CA, Behncken SN, Tam SP, Li H, Shen B, Lobie PE1999. Growth hormone as a cytokine. Clin Exp Pharmacol Physiol 26:760–764 - PubMed
    1. Wabitsch M, Hauner H, Heinze E, Teller W1994. In vitro effects of growth hormone in adipose tissue. Acta Paediatr Suppl 406:48–53 - PubMed
    1. Wabitsch M, Hauner H, Heinze E, Teller WM1995. The role of growth hormone/insulin-like growth factors in adipocyte differentiation. Metabolism 44:45–49 - PubMed
    1. Wabitsch M, Braun S, Hauner H, Heinze E, Ilondo MM, Shymko R, De Meyts P, Teller WM1996. Mitogenic and antiadipogenic properties of human growth hormone in differentiating human adipocyte precursor cells in primary culture. Pediatr Res 40:450–456 - PubMed

Publication types

MeSH terms