. 2009 Apr;37(4):776-86.
doi: 10.1124/dmd.108.024927. Epub 2008 Dec 30.

Disposition of the herbicide 2-chloro-4-(ethylamino)-6-(isopropylamino)-s-triazine (Atrazine) and its major metabolites in mice: a liquid chromatography/mass spectrometry analysis of urine, plasma, and tissue levels

Affiliations

Disposition of the herbicide 2-chloro-4-(ethylamino)-6-(isopropylamino)-s-triazine (Atrazine) and its major metabolites in mice: a liquid chromatography/mass spectrometry analysis of urine, plasma, and tissue levels

Matthew K Ross et al. Drug Metab Dispos. 2009 Apr.

Abstract

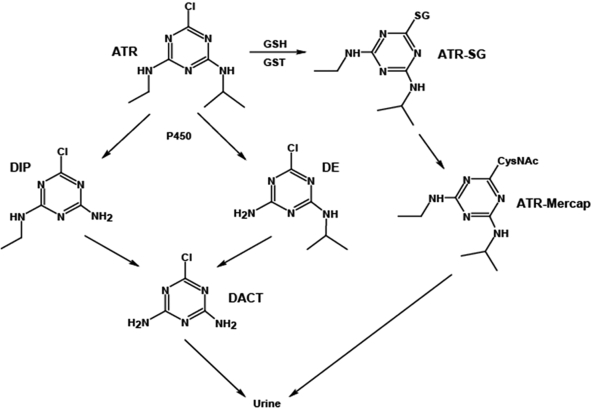
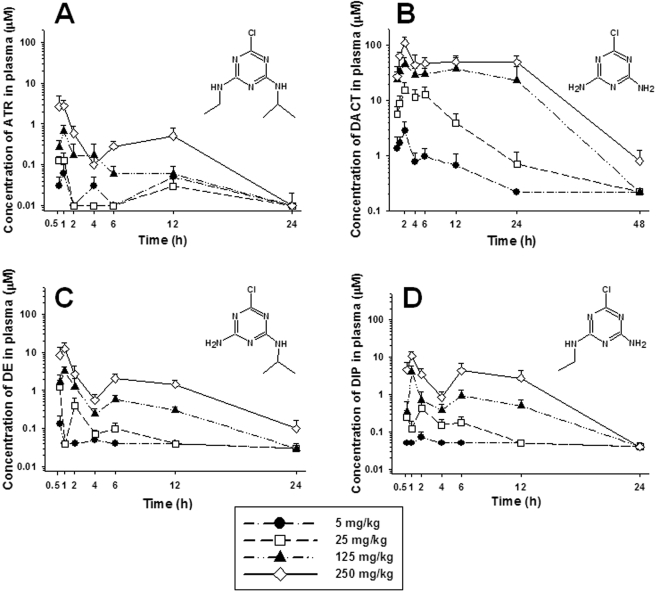
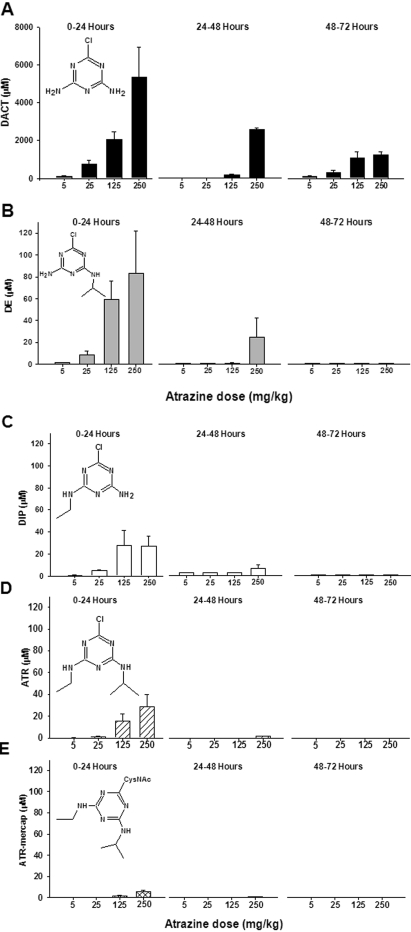
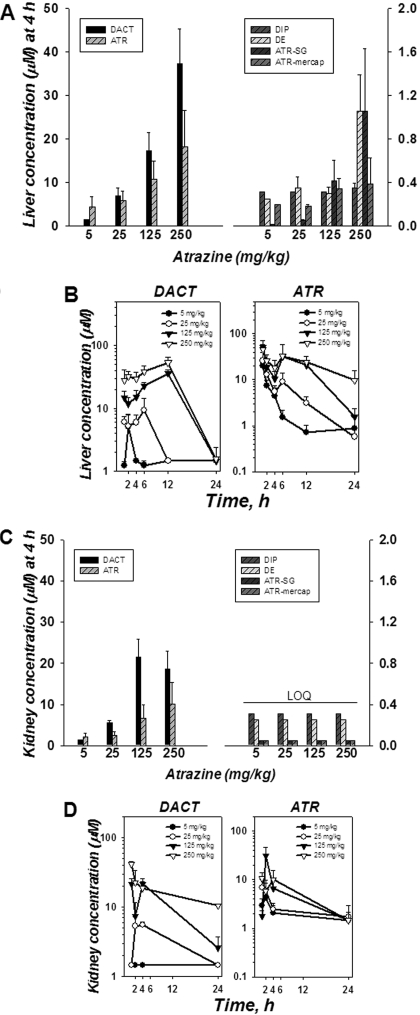
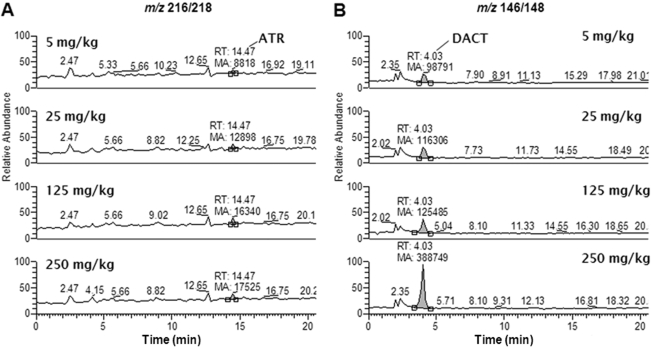
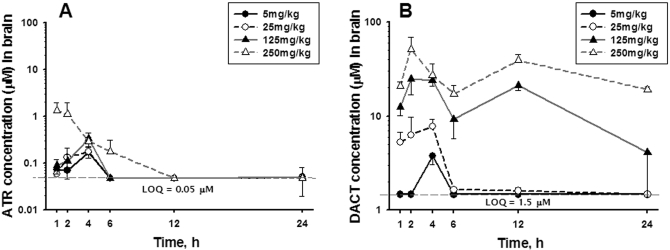
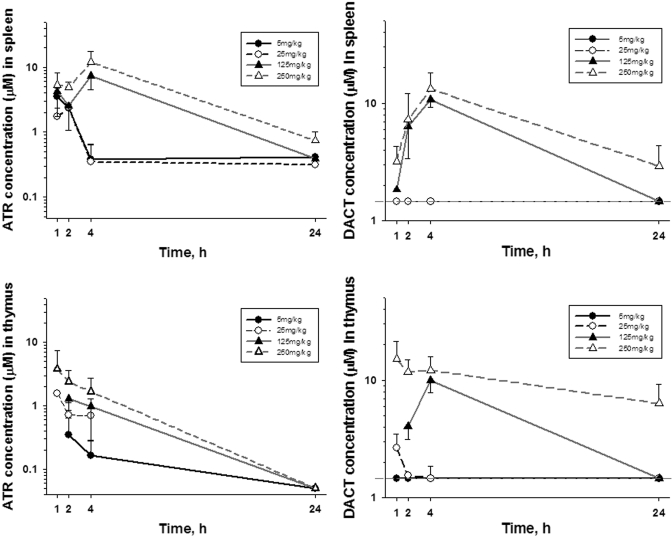
2-Chloro-4-(ethylamino)-6-(isopropylamino)-s-triazine (atrazine, ATR) is a toxicologically important and widely used herbicide. Recent studies have shown that it can elicit neurological, immunological, developmental, and biochemical alterations in several model organisms, including in mice. Because disposition data in mice are lacking, we evaluated ATR's metabolism and tissue dosimetry after single oral exposures (5-250 mg/kg) in C57BL/6 mice using liquid chromatography/mass spectrometry (Ross and Filipov, 2006). ATR was metabolized and cleared rapidly; didealkyl ATR (DACT) was the major metabolite detected in urine, plasma, and tissues. Plasma ATR peaked at 1 h postdosing and rapidly declined, whereas DACT peaked at 2 h and slowly declined. Most ATR and metabolite residues were excreted within the first 24 h. However, substantial amounts of DACT were still present in 25- to 48-h and 49- to 72-h urine. ATR reached maximal brain levels (0.06-1.5 microM) at 4 h (5-125 mg/kg) and 1 h (250 mg/kg) after dosing, but levels quickly declined to <0.1 microM by 12 h in all the groups. In contrast, strikingly high concentrations of DACT (1.5-50 microM), which are comparable with liver DACT levels, were detectable in brain at 2 h. Brain DACT levels slowly declined, paralleling the kinetics of plasma DACT. Our findings suggest that in mice ATR is widely distributed and extensively metabolized and that DACT is a major metabolite detected in the brain at high levels and is ultimately excreted in urine. Our study provides a starting point for the establishment of models that link target tissue dose to biological effects caused by ATR and its in vivo metabolites.


Figures

F<sc>ig</sc>. 1.
Fig. 1.
Biotransformation of ATR in mammals. See Table 1 for detailed definition of abbreviations.
F<sc>ig</sc>. 2.
Fig. 2.
Concentration of ATR and its metabolites in mouse plasma determined by LC/MS at the indicated time points after single ATR treatments at four different dose levels. A, concentration of ATR. B, concentration of DACT. C, concentration of DE. D, concentration of DIP. Each time point represents the mean ± S.E.M.; n = 5, 8, 8, 8, 6, 6, and 8 mice/dose for plasma samples collected at 0.5, 1, 2, 4, 6, 12, and 24 h, respectively.
F<sc>ig</sc>. 3.
Fig. 3.
Concentration of ATR and its metabolites in mouse urine after single ATR treatments at four different dose levels. Cumulative 0- to 24-, 24- to 48-, and 48- to 72-h urine samples were collected and analyzed for DACT (A), DE (B), DIP (C), ATR (D), and ATR-mercap (E). Note the difference in y-axis scales for DACT versus other analytes. Each time point represents the mean ± S.E.M.; n = 8 mice/dose for 0- to 24-h urine samples and 5 mice/dose for 24- to 48- and 48- to 72-h urine samples.
F<sc>ig</sc>. 4.
Fig. 4.
Concentration of ATR and its metabolites in mouse liver (A and B) and kidney (C and D) after single ATR treatments at four different dose levels. Bar graphs represent the distribution of ATR and metabolites in liver (A) and kidney (C) at 4 h, respectively. Note scale differences of y-axes. LOQ, all the analytes were less than the limit of quantitation. Time course of DACT and ATR concentrations in liver (B) and kidney (D), respectively. Each time point represents the mean ± S.E.M.; n = 7, 8, 8, 5, 3, and 2 mice/dose for liver and n = 6, 5, 8, 5, 3, and 2 mice/dose for kidney tissue samples collected at 1, 2, 4, 6, 12, and 24 h, respectively.
F<sc>ig</sc>. 5.
Fig. 5.
Representative LC/MS ion chromatograms of brain extracts prepared from mice that had been treated with ATR at 5, 25, 125, and 250 mg/kg. Brains were collected 4 h after the indicated dose of ATR and processed as described under Materials and Methods. Single-ion monitoring chromatograms for ATR (m/z 216/218; A) and DACT (m/z 146/148; B) in brain extracts from each dose group. RT, retention time for target analyte peak; MA, mass area for target analyte peak.
F<sc>ig</sc>. 6.
Fig. 6.
Concentration of ATR (A) and DACT (B) in mouse brain at the indicated time points after single ATR treatments at four different dose levels. Each time point represents the mean ± S.E.M.; n = 8, 8, 8, 6, 6, and 8 mice/dose for brain tissue samples collected at 1, 2, 4, 6, 12, and 24 h, respectively.
F<sc>ig</sc>. 7.
Fig. 7.
Concentration of ATR and DACT in mouse spleen (A and B) and thymus (C and D), respectively, at the indicated time points after single ATR treatments at four different dose levels. Each time point represents the mean ± S.E.M. of n = 5 mice, except for the 24-h samples (n = 2).

References

    1. Adams NH, Hodgson E, and Levi PE (1990) In vitro studies of the metabolism of atrazine, simazine, and terbutryn in several vertebrate species. J Agric Food Chem 38 1411–1417.
    1. Bakke JE, Larson JD, and Price CE (1972) Metabolism of atrazine and 2-hydroxyatrazine by the rat. J Agric Food Chem 20 602–607. - PubMed
    1. Barr DB, Panuwet P, Nguyen JV, Udunka S, and Needham LL (2007) Assessing exposure to atrazine and its metabolites using biomonitoring. Environ Health Perspect 115 1474–1478. - PMC - PubMed
    1. Brzezicki JM, Andersen ME, Cranmer BK, and Tessari JD (2003) Quantitative identification of atrazine and its chlorinated metabolites in plasma. J Anal Toxicol 27 569–573. - PubMed
    1. Catenacci G, Barbieri F, Bersani M, Ferioli A, Cottica D, and Maroni M (1993) Biological monitoring of human exposure to atrazine. Toxicol Lett 69 217–222. - PubMed

Publication types

LinkOut - more resources