. 2009 Mar;20(5):1408-18.
doi: 10.1091/mbc.e08-07-0786. Epub 2008 Dec 30.

Galectin-1 induces reversible phosphatidylserine exposure at the plasma membrane

Affiliations

Galectin-1 induces reversible phosphatidylserine exposure at the plasma membrane

Sean R Stowell et al. Mol Biol Cell. 2009 Mar.

Abstract

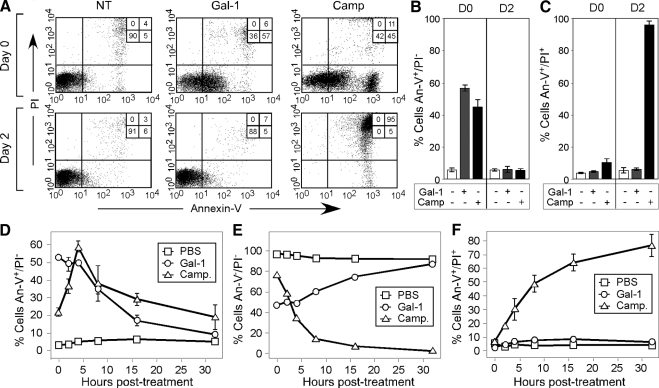
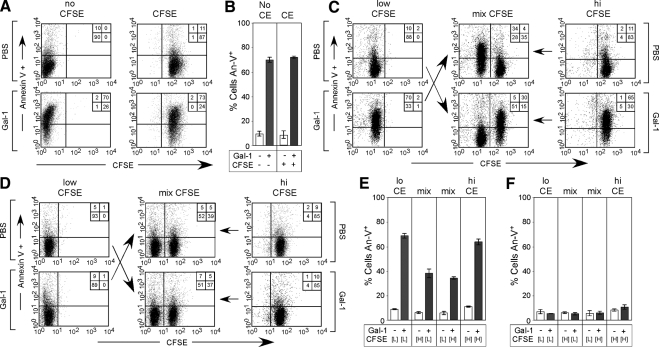
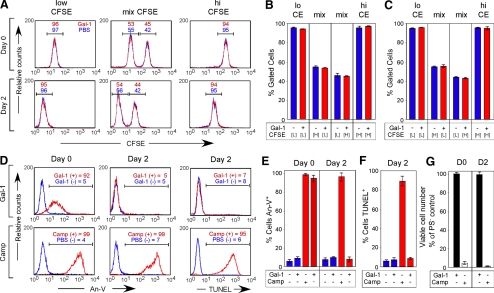
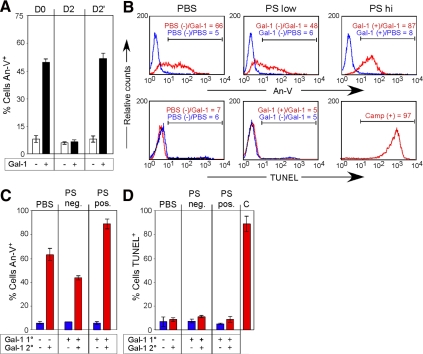
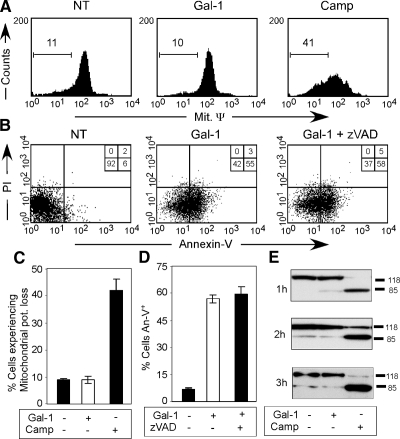
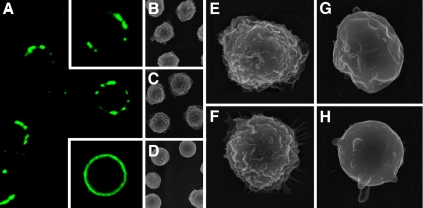
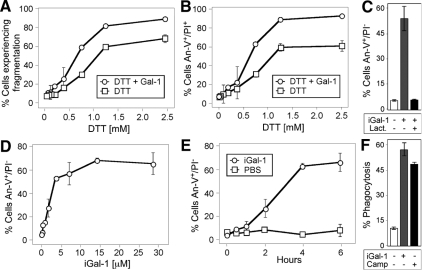
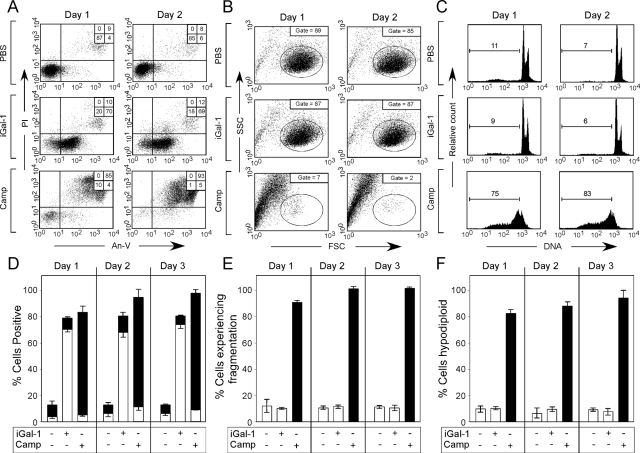
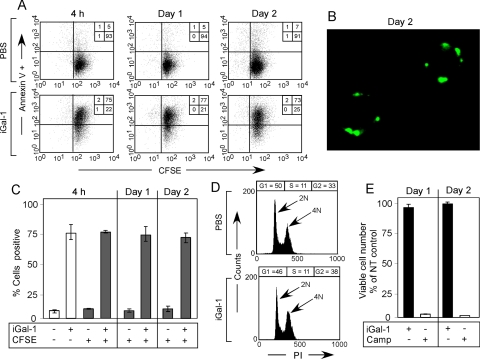
Cells normally undergo physiological turnover through the induction of apoptosis and phagocytic removal, partly through exposure of cell surface phosphatidylserine (PS). In contrast, neutrophils appear to possess apoptosis-independent mechanisms of removal. Here we show that Galectin-1 (Gal-1) induces PS exposure independent of alterations in mitochondrial potential, caspase activation, or cell death. Furthermore, Gal-1-induced PS exposure reverts after Gal-1 removal without altering cell viability. Gal-1-induced PS exposure is uniquely microdomain restricted, yet cells exposing PS do not display evident alterations in membrane morphology nor do they exhibit bleb formation, typically seen in apoptotic cells. Long-term exposure to Gal-1 prolongs PS exposure with no alteration in cell cycle progression or cell growth. These results demonstrate that Gal-1-induced PS exposure and subsequent phagocytic removal of living cells represents a new paradigm in cellular turnover.


Figures

Figure 1.
Figure 1.
Gal-1 induces reversible PS exposure. (A) HL60 cells were treated with PBS (NT), 10 μM Gal-1, or 10 μM camptothecin (Camp) for 12 h followed by immediate detection for PS exposure using annexin-V (An-V)-FITC, propidium iodide (PI), and subsequent flow cytometric analysis (0 h) or were washed in lactose and reincubated in complete RPMI for 2 d followed by detection for PS exposure using An-V-FITC, PI, and subsequent flow cytometric analysis. (B and C) As outlined in A, quantification of PS exposure (B) by An-V staining or cell death (C) indicated by the PI positivity of cells evaluated immediately after treatment for 12 h (D0) or after removal of Gal-1 and incubation for 2 d (D2). (D–F) HL60 cells were treated with PBS (NT), 10 μM Gal-1, or 10 μM camptothecin (Camp) for 12 h followed by Gal-1 removal and detection for PS exposure using An-V-FITC, PI, and subsequent flow cytometric analysis at the indicated times after Gal-1 removal. (D) Cells that only stain with An-V-FITC; (E) Cells staining with neither An-V-FITC or PI; and (F) Cells staining with both An-V-FITC and PI.
Figure 2.
Figure 2.
PS reversion does not represent PS-positive cellular removal. (A) Cells were incubated with or without CFSE followed by incubation with Gal-1 and detection for PS exposure using An-V-FITC. (B) Quantification of PS exposure of cells treated with or without CFSE (CE). (C) Cells were differentially stained with CFSE followed by incubation with PBS or 10 μM Gal-1 for 4 h. After the 4-h incubation, cells were incubated with 50 mM lactose to remove Gal-1. Cells were then either incubated alone or mixed, followed by immediate examination of PS exposure using An-V-FITC (C) or were resuspended in complete RPMI and allowed to incubate alone or mixed as outlined for 2 d, followed by detection for PS using An-V-FITC (D). (E) Quantification of PS exposure of cells treated in C. (F) Quantification of PS exposure of cells treated in D.
Figure 3.
Figure 3.
PS-positive cells display unaltered cell division during PS reversion. (A) Cells were differentially stained with CFSE followed by incubation with PBS or 10 μM Gal-1 for 4 h. After the 4-h incubation, cells were incubated with 50 mM lactose to remove Gal-1. Cells were then either not mixed or mixed followed either by immediate enumeration of cell percentages in each population (Day 0) or resuspended in complete RPMI and allowed to incubate alone or mixed as outlined for 2 d, followed by enumeration of cell percentages in each population (Day 2), with red representing those cells treated with Gal-1 and blue representing those cells treated with PBS. (B and C) Quantification of the percent of cells in each population at Day 0 (B) and Day 2 (C), with red representing those cells treated with Gal-1 and blue representing those cells treated with PBS. (D) Top panels, cells were sorted into PS-positive (red, Gal-1–treated PS-positive) or PS negative (blue, Gal-1–treated PS negative) fractions followed by either restaining for PS using An-V-FITC or reincubating in complete RPMI for 2 d to allow PS reversion. After the 2-d incubation, cells were stained for PS using An-V-FITC or analyzed for DNA degradation using TUNEL. Bottom, cells were treated with PBS or 10 μM Camp followed by sorting into PS-positive (red, Camp-treated PS-positive) or PS-negative (blue, PBS-treated PS negative) fractions, followed by either restaining for PS using An-V-FITC or reincubating in complete RPMI for 2 d to allow PS reversion. After the 2-d incubation, cells were stained for PS using An-V-FITC or analyzed for DNA degradation using TUNEL. (E and F) Quantification of cells treated as outlined in D for either PS exposure (E) or DNA fragmentation using TUNEL (F). (G) PS-positive cells sorted after treatment with Gal-1 or Camp as outlined in D were resuspended in RPMI for 2 d, followed by enumeration of viable cell number using a hemocytometer and trypan blue exclusion. Cell numbers are reported as the percent of the PBS-treated PS-negative control.
Figure 4.
Figure 4.
Cells previously positive for PS remain sensitive to restimulation by Gal-1. (A) Cells were incubated with 10 μM Gal-1 for 4 h followed by removal of Gal-1 with 50 mM lactose and either detection of PS exposure by An-V-FITC and PI staining or resuspension in complete RPMI. Resuspended cells were allowed to incubate for 2 d (Day 2) to revert PS, followed by incubation with 10 μM Gal-1 for 4 h and detection for PS (Day 2′). (B) Top, PS-positive or -negative cells previously incubated with Gal-1 or PS-negative cells treated with PBS were retreated with 10 μM Gal-1 or PBS for 4 h (Primary treatment/Secondary treatment) followed by detection of PS with An-V-FITC. Gate values are shown. Bottom, PS-positive or -negative cells previously incubated with Gal-1 or PS-negative cells treated with PBS were retreated with 10 μM Gal-1 or PBS for 10 h (Primary treatment/Secondary treatment) followed by analysis for DNA fragmentation. Gate values are shown. (C and D) Quantification of cells treated as outlined in B for either PS exposure (C) or DNA fragmentation using TUNEL (D).
Figure 5.
Figure 5.
Gal-1 induces PS exposure through a caspase-independent process. (A) Cells were incubated with PBS (NT), 10 μM Gal-1, or 10 μM Camp for 8 h as indicated, followed by examination for alterations in mitochondrial potential change. (B) Cells were incubated with or without zVAD-fmk, followed by incubation with 10 μM Gal-1 for 4 h and analyzed for PS exposure by staining with An-V-FITC. (C) Quantification of cells treated as outlined in A. (D) Quantification of cells treated as outlined in B. (E) Cells were incubated with 10 μM Gal-1 or 10 μM Camp for the indicated times, followed by cell lysis and examination of PARP cleavage by SDS-PAGE and Western blot analysis.
Figure 6.
Figure 6.
Gal-1–induced PS exposure resides in punctate microdomains. (A) Cells were incubated with 10 μM Gal-1 for 12 h followed by staining with An-V. Top inset, representative cell treated with 10 μM Gal-1. Bottom inset, representative cell treated with 10 μM Camp. (B–H) SEM analysis of cells treated with PBS (B and E), 10 μM Gal-1 (C and F), or anti-Fas (D, G, and H).
Figure 7.
Figure 7.
DTT sensitizes cells to Gal-1–induced apoptosis. (A) Cells were incubated with PBS, 10 μM Gal-1, or the indicated concentration of DTT for 9 h, followed by detection for cellular fragmentation as indicated by changes in forward (FSC) and side scatter (SSC) profiles of cells. (B) Cells were incubated with PBS, 10 μM Gal-1, or the indicated concentration of DTT for 9 h, followed by detection for cell death by PS exposure and membrane integrity loss by An-V-FITC and PI staining. (C) Cells were incubated with PBS, 10 μM iGal-1, or 10 μM iGal-1 with 20 mM lactose, followed by detection for PS exposure by An-V-FITC staining and PI exclusion. (D) Cells were incubated with PBS or the indicated concentration of iGal-1 for 8h followed by detection for PS exposure by An-V-FITC staining and PI exclusion. (E) Cells were incubated with PBS or 10 μM iGal-1 for the indicated time followed by detection for PS exposure by An-V-FITC staining and PI exclusion. (F) Cells were incubated with PBS, 10 μM iGal-1, or 10 μM Camp for 8 h, followed by incubation of peritoneal macrophages for 1 h and microscopic examination of phagocytosis.
Figure 8.
Figure 8.
iGal-1 induces continuous PS exposure. (A) Cells were incubated with PBS, 10 μM iGal-1, or 10 μM Camp for 1 or 2 d as indicated, followed by detection for PS exposure by An-V-FITC staining and PI exclusion. (B) Cells were incubated with PBS, 10 μM iGal-1, or 10 μM Camp for 1 or 2 d as indicated, followed by examination for cellular fragmentation as indicated by changes in forward (FSC) and side scatter (SSC) profiles of cells. Gate = % of cells experiencing no fragmentation. (C) Cells were incubated with PBS, 10 μM iGal-1, or 10 μM Camp for 1 or 2 d as indicated, followed by measuring DNA fragmentation by hypodiploid analysis. Gate = % of cells experiencing DNA fragmentation. (D) Quantification of cells treated in A. White bars = % An-V+, black bars = % PI+. (E) Quantification of cells treated in B. (F) Quantification of cells treated in (C).
Figure 9.
Figure 9.
iGal-1 induces sustained PS exposure without altering cell division. (A) Cells were labeled with CFSE, followed by incubation with 10 μM iGal-1 for 4 h, 1 d, or 2 d as indicated, followed by detection for PS exposure by An-V-FITC. (B) Cells were incubated with 10 μM iGal-1 for 2 d followed by confocal analysis for PS exposure by An-V. (C) Quantification of data in A. (D) Cells were incubated with 10 μM iGal-1 for 24 h, followed by cell cycle analysis. (E) Cells were incubated with PBS, 10 μM iGal-1 or 10 μM Camp for 1 or 2 d, followed by enumerating viable cell number using trypan blue exclusion.

References

    1. Adams L., Scott G. K., Weinberg C. S. Biphasic modulation of cell growth by recombinant human galectin-1. Biochim. Biophys. Acta. 1996;1312:137–144. - PubMed
    1. Antia R., Ganusov V. V., Ahmed R. The role of models in understanding CD8+ T-cell memory. Nat. Rev. Immunol. 2005;5:101–111. - PubMed
    1. Barber D. L., Wherry E. J., Ahmed R. Cutting edge: rapid in vivo killing by memory CD8 T cells. J. Immunol. 2003;171:27–31. - PubMed
    1. Braakman I., Helenius J., Helenius A. Manipulating disulfide bond formation and protein folding in the endoplasmic reticulum. EMBO J. 1992;11:1717–1722. - PMC - PubMed
    1. Carlow D. A., Williams M. J., Ziltener H. J. Modulation of O-glycans and N-glycans on murine CD8 T cells fails to alter annexin V ligand induction by galectin 1. J. Immunol. 2003;171:5100–5106. - PubMed

Publication types