

Noninvasive assessment of pancreatic beta-cell function in vivo with manganese-enhanced magnetic resonance imaging
- PMID: 19116376
- PMCID: PMC2660140
- DOI: 10.1152/ajpendo.90336.2008
Noninvasive assessment of pancreatic beta-cell function in vivo with manganese-enhanced magnetic resonance imaging
Abstract
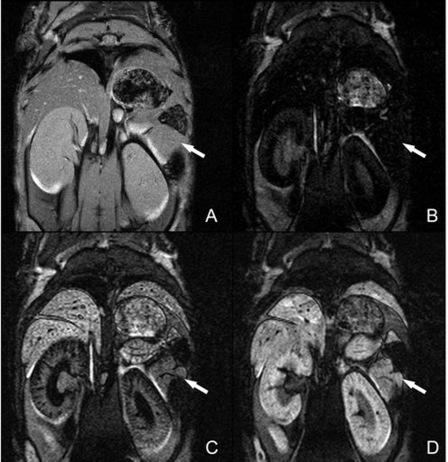
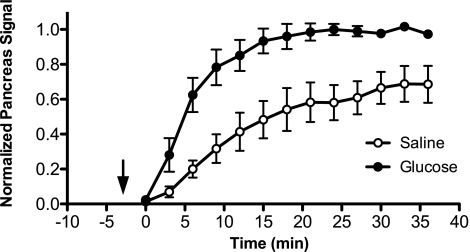
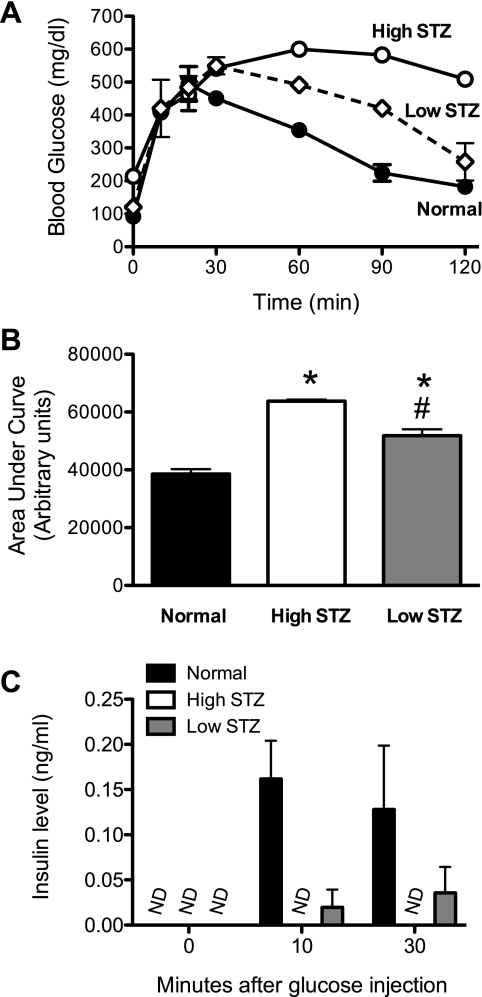
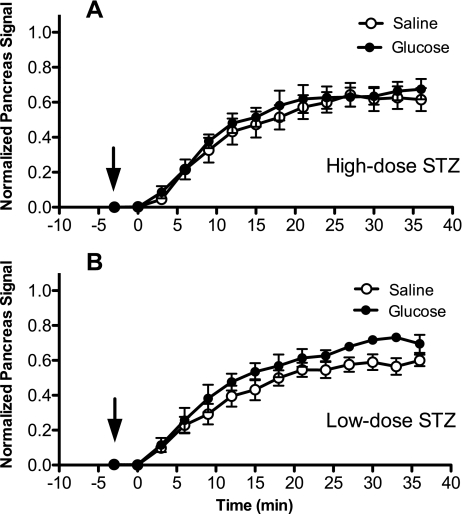
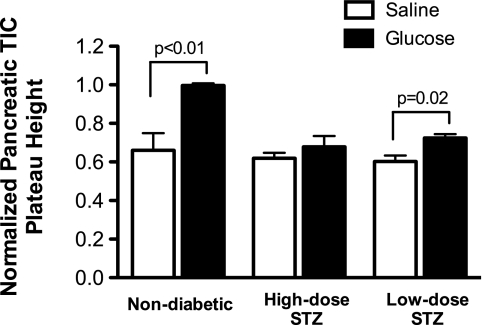
Loss of beta-cell function in type 1 and type 2 diabetes leads to metabolic dysregulation and inability to maintain normoglycemia. Noninvasive imaging of beta-cell function in vivo would therefore provide a valuable diagnostic and research tool for quantifying progression to diabetes and response to therapeutic intervention. Because manganese (Mn(2+)) is a longitudinal relaxation time (T1)-shortening magnetic resonance imaging (MRI) contrast agent that enters cells such as pancreatic beta-cells through voltage-gated calcium channels, we hypothesized that Mn(2+)-enhanced MRI of the pancreas after glucose infusion would allow for noninvasive detection of beta-cell function in vivo. To test this hypothesis, we administered glucose and saline challenges intravenously to normal mice and mice given high or low doses of streptozotocin (STZ) to induce diabetes. Serial inversion recovery MRI was subsequently performed after Mn(2+) injection to probe Mn(2+) accumulation in the pancreas. Time-intensity curves of the pancreas (normalized to the liver) fit to a sigmoid function showed a 51% increase in signal plateau height after glucose stimulation relative to saline (P < 0.01) in normal mice. In diabetic mice given a high dose of STZ, only a 9% increase in plateau signal intensity was observed after glucose challenge (P = not significant); in mice given a low dose of STZ, a 20% increase in plateau signal intensity was seen after glucose challenge (P = 0.02). Consistent with these imaging findings, the pancreatic insulin content of high- and low-dose STZ diabetic mice was reduced about 20-fold and 10-fold, respectively, compared with normal mice. We conclude that Mn(2+)-enhanced MRI demonstrates excellent potential as a means for noninvasively monitoring beta-cell function in vivo and may have the sensitivity to detect progressive decreases in function that occur in the diabetic disease process.
Figures
References
-
- Amrani A, Durant S, Throsby M, Coulaud J, Dardenne M, Homo-Delarche F. Glucose homeostasis in the nonobese diabetic mouse at the prediabetic stage. Endocrinology 139: 1115–1124, 1998. - PubMed
-
- Bell GI, Polonsky KS. Diabetes mellitus and genetically programmed defects in beta-cell function. Nature 414: 788–791, 2001. - PubMed
-
- Evgenov NV, Medarova Z, Dai G, Bonner-Weir S, Moore A. In vivo imaging of islet transplantation. Nat Med 12: 144–148, 2006. - PubMed
-
- Evgenov NV, Medarova Z, Pratt J, Pantazopoulos P, Leyting S, Bonner-Weir S, Moore A. In vivo imaging of immune rejection in transplanted pancreatic islets. Diabetes 55: 2419–2428, 2006. - PubMed
-
- Fowler M, Virostko J, Chen Z, Poffenberger G, Radhika A, Brissova M, Shiota M, Nicholson WE, Shi Y, Hirshberg B, Harlan DM, Jansen ED, Powers AC. Assessment of pancreatic islet mass after islet transplantation using in vivo bioluminescence imaging. Transplantation 79: 768–776, 2005. - PubMed
Publication types
MeSH terms
Substances
Grants and funding
LinkOut - more resources
Full Text Sources
Medical