. 2009 Jan 7;9(1):52-63.
doi: 10.1016/j.cmet.2008.11.005.

A mathematical model of murine metabolic regulation by leptin: energy balance and defense of a stable body weight

Affiliations

A mathematical model of murine metabolic regulation by leptin: energy balance and defense of a stable body weight

Joshua Tam et al. Cell Metab. .

Abstract

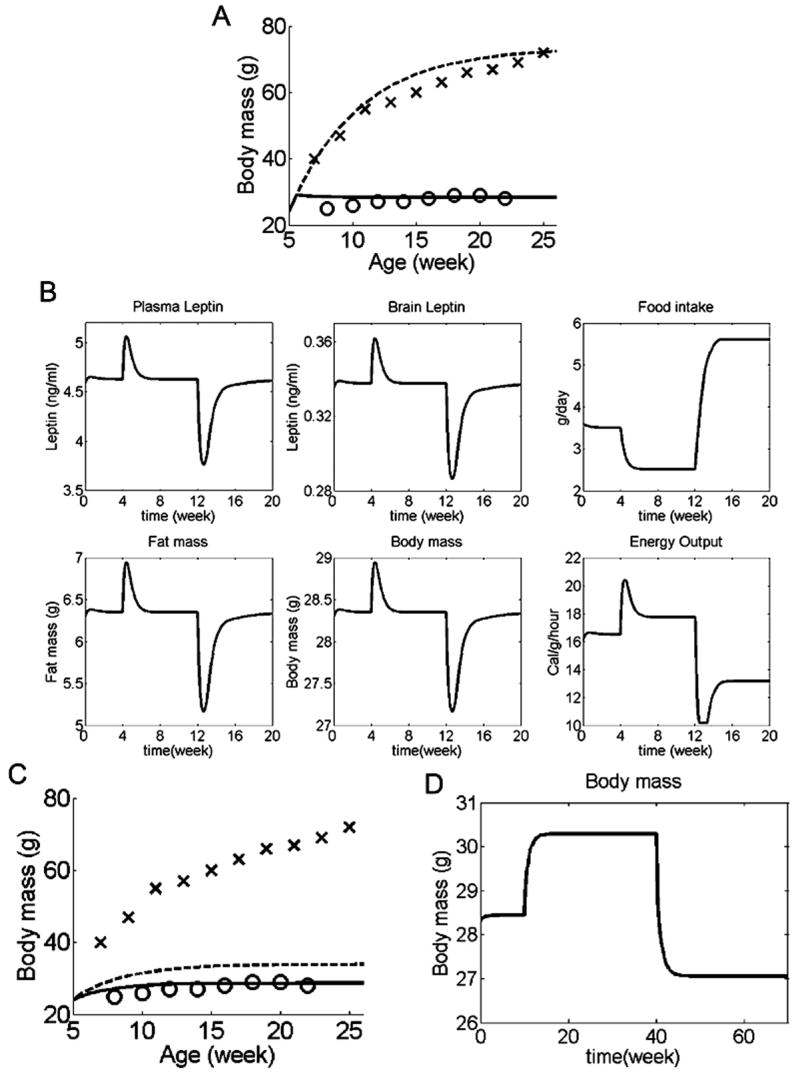
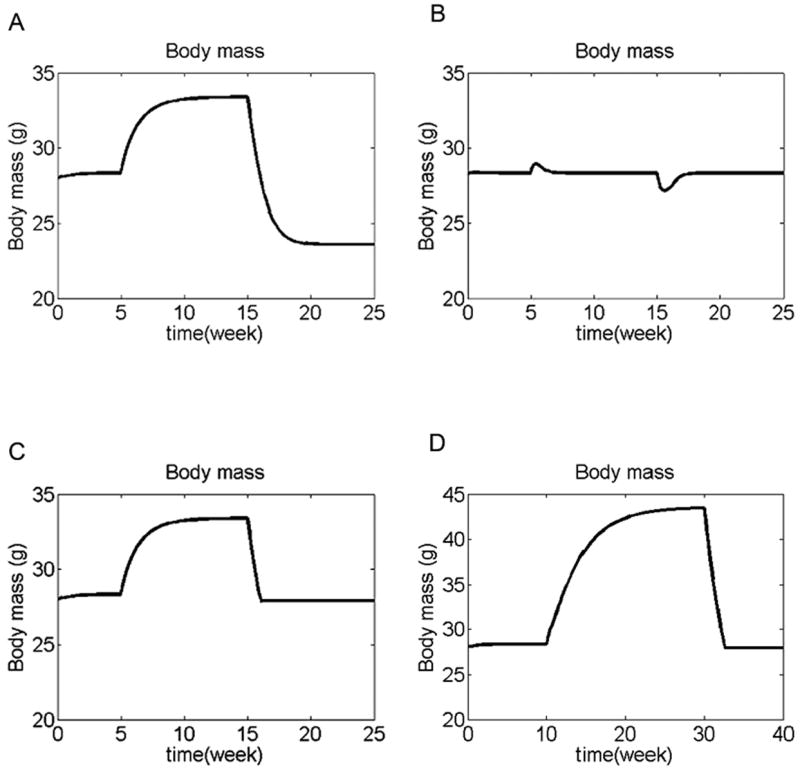
We have developed a physiologically based mathematical model, with parameters derived from published experimental data, to simulate the regulatory effects of the leptin pathway on murine energy homeostasis. Model outcomes are consistent with data reported in the literature and reproduce key characteristics of the energy regulatory system, including compensatory responses that counteract changes in body weight and the failure of this ability when the leptin pathway is disrupted. Our model revealed the possibility of multiple steady states for body weight. It also provided a unified theoretical framework for two historically antagonistic hypotheses regarding body weight regulation ("set-point" versus "settling point"). Finally, our model has identified potential avenues for future investigations.


Figures

Figure 1
Figure 1
Model of leptin action. White arrow: flow of energy. Dark arrows: flow of information conveyed by neuroendocrine signals. Leptin is produced by fat in proportion to fat mass, it travels to and stimulates the energy regulatory centers in the CNS, which then send out efferent signals to regulate food intake and energy expenditure. The equation numbers refer to equations in the rest of this article that will be used to describe the different components in this system.
Figure 2
Figure 2
Metabolic consequences of disrupted leptin pathway in the settling point model. (A) Body weight in simulated WT mice (solid line) compared to leptin knockout mice (dotted line). Crosses: body weight of leptin knockout mice of C57Bl6/J background, as reported by the Jackson Laboratory (“Weight gain in B6.V-Lepob/J mice”, http://jaxservices.jax.org/technotes/invivo010906.html). Circles: body weight of WT C57Bl6/J males (J. Tam, unpublished data). Simulation outcomes for both leptin knockout and WT mice are similar to experimental results. (B) Simulated food intake in WT versus leptin knockout mice (ob). (C) Total energy expenditure in WT (solid line) versus leptin knockout (dotted line) mice. (D) Simulated energy expenditure normalized by body weight, in WT (solid line) versus leptin knockout (dotted line) mice.
Figure 3
Figure 3
Adaptive changes in response to altered energy intake for the settling point model. Normal diet was eaten during weeks 0-4, while diet energy content was decreased (A), or increased (B) by 50% during weeks 4-12. Plasma and brain leptin levels, fat mass, and total body weight decreased during food restriction and increased during overfeeding, reaching new steady state values. In both cases, food intake and energy expenditure changed in directions that opposed the change in dietary energy content, so that the change in fat mass was diminished.
Figure 4
Figure 4
Simulation of peripheral leptin resistance. (A) Modification of k2 according to Equation 10. k2 increases at plasma leptin concentrations larger than the threshold level set by k10. k2,0 = baseline value of k2. The rate of increase of k2 is determined by k9. (B) Blood-to-brain transport of leptin is decreased by increasing values of k2. Each curve represents the relationship between plasma and brain leptin concentrations at one particular value of k2. (C,D) Simulation of mice with different susceptibility towards leptin resistance, compared to experimental data from Parekh et al. (Parekh et al., 1998). Mice were given 4 different diet regiments over 8 months: low fat diet all 8 months (L8), high fat diet for 4 months then low fat diet for 4 months (H4L4), low fat diet for 4 months then high fat diet for 4 months (L4H4), or high fat diet for 8 months (H8). Dietary caloric content as reported by Parekh et al. Crosses and error bars represent data reported by Parekh et al., while grey bars represent simulation results. (C) When the value of k9 is small, the simulated animal is consistent with mouse strains such as A/J that are resistant to diet-induced obesity. (D) When the value of k9 is large, the simulated animal is consistent with mouse strains such as C57Bl/6J that are susceptible to diet-induced obesity. (E) Multiple steady states are possible when model parameters are permissible. The values of k9 and k10 in Equation 10 were set to 7 and 9, respectively, then the simulation was repeated with low fat diet for 4 months, high fat diet for 4 months, then returned to low fat diet for 8 months. Even though all other external variables, including the diet, were identical, the steady state body weights (arrows) were different before and after exposure to the high fat diet. (F) Energy intake (solid line) and expenditure (dashed line) are plotted as functions of plasma leptin concentration. Steady state occurs when energy intake equals expenditure (i.e. when the two curves intersect each other). With model parameters used in (E) and a low fat diet, there are two possible stable steady states (black arrows), and a third steady state that is unstable (white arrow). If acute fluctuations (such as a temporary therapeutic intervention or change in diet) in system inputs lead to leptin levels on the left of the point denoted by the white arrow, the system will eventually settle on the lower steady state (arrow 1). When fluctuations lead to leptin levels on the right of this white arrow, the system will settle on the higher steady state (arrow 2) instead.
Figure 5
Figure 5
Simulations for set-point model. (A) Body weight in simulated WT mice (solid line) compared to leptin knockout mice (dotted line). Experimental data for body weights of leptin knockout mice (crosses) and WT C57Bl6/J mice (circles) are the same as Figure 2. Simulation outcomes for both leptin knockout and WT mice are similar to experimental data, and comparable to the settling point model. (B) Adaptive changes in response to altered energy intake. Normal diet was eaten during weeks 0-4, while diet energy density 50% above normal during weeks 4-12, and 50% below normal during weeks 12-20. In both cases, compensatory changes in food intake and energy expenditure combined to return body weight to the set-point (body weight at which brain leptin concentration = 0.34 ng/g). (C, D) Set-point system with a set-point that changes in proportion to the error signal, described mathematically by the equation: d(SetPt)dt=α(LepBrainSetPt), where α = a constant. With this definition of a set-point, the set point reversibly adapts to existing leptin levels. (C) With this changeable set-point, body weight in simulated wildtype mice (solid line) is still similar to experimental data (circles). However, in simulated leptin knockout mice (dotted line) the set-point is continuously lowered so that body weight in these similated mice was much lower than experimental data (crosses). (D) In wildtype mice with an adaptable set-point, the system behaves much more similar to a settling point system than a set-point system (normal diet for weeks 0-10, diet energy density 50% above normal for weeks 10-40, 50% below normal for weeks 40-70).
Figure 6
Figure 6
Different responses to altered energy intake by the different simulation models. (A-C) Normal diet was eaten during weeks 0-5. Diet energy density was 50% above normal during weeks 5-15, and 50% below normal during weeks 15-30. (A) Settling point model. This model partially compensates for the change in dietary energy, but the compensation is not complete, leading to a new steady state for each diet. This model is compatible with diet-induced obesity, and animals (such as cats and dogs) that do not compensate well against reduced dietary energy density. (B) Set-point model. This model completely compensates for the change in dietary energy density, so that body weight always returns to the set-point value. This model is incompatible with diet-induced obesity, but the response to reduced dietary energy is consistent with animals (such as rats) that are able to maintain their body weights despite reduced dietary energy density. (C) Steady-state-plus-threshold model. With increased dietary energy density (weeks 5-15), this model behaves like the settling point model, allowing body weight to reach a new steady state. But at reduced dietary energy density (weeks 15-30), the control action becomes active, returning body weight to the threshold level (in this simulation the threshold brain leptin level was set to be 0.32 ng/g, close to the baseline steady state level, so as to be consistent with previous data showing mice given diluted diets maintain their body weights close to those of mice given standard chow ad libitum (Dalton, 1965)). This model allows the development of diet-induced obesity, but also protects more vigorously against starvation. The x- and y-axes are kept constant for graphs A-C for easy comparison. (D) Leptin resistance (as mathematically defined earlier) was included in the steady-state-plus-threshold system. Normal diet was eaten during weeks 0-10. Diet energy density was 50% above normal during weeks 10-30, and 50% below normal during weeks 30-40. The simulated animal developed diet-induced obesity when dietary caloric density was increased, but was able to compensate for below-normal dietary caloric density and prevent its body weight from falling below the threshold level.

Comment in

References

    1. Abdel-Hamid TK. Exercise and diet in obesity treatment: an integrative system dynamics perspective. Med Sci Sports Exerc. 2003;35:400–413. - PubMed
    1. Ahima RS, Prabakaran D, Mantzoros C, Qu D, Lowell B, Maratos-Flier E, Flier JS. Role of leptin in the neuroendocrine response to fasting. Nature. 1996;382:250–252. - PubMed
    1. Badman MK, Flier JS. The adipocyte as an active participant in energy balance and metabolism. Gastroenterology. 2007;132:2103–2115. - PubMed
    1. Banks WA, Clever CM, Farrell CL. Partial saturation and regional variation in the blood-to-brain transport of leptin in normal weight mice. Am J Physiol Endocrinol Metab. 2000;278:E1158–1165. - PubMed
    1. Banks WA, DiPalma CR, Farrell CL. Impaired transport of leptin across the blood-brain barrier in obesity. Peptides. 1999;20:1341–1345. - PubMed

Publication types