. 2009 Mar;101(3):1524-41.
doi: 10.1152/jn.00651.2007. Epub 2008 Dec 31.

Quantitative assessment of the distributions of membrane conductances involved in action potential backpropagation along basal dendrites

Affiliations

Quantitative assessment of the distributions of membrane conductances involved in action potential backpropagation along basal dendrites

Corey D Acker et al. J Neurophysiol. 2009 Mar.

Abstract

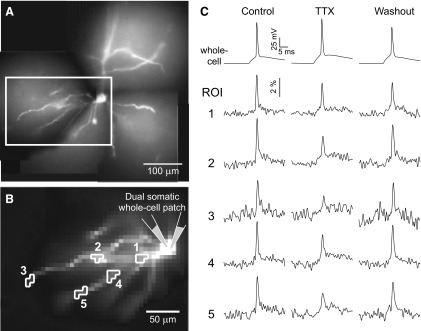
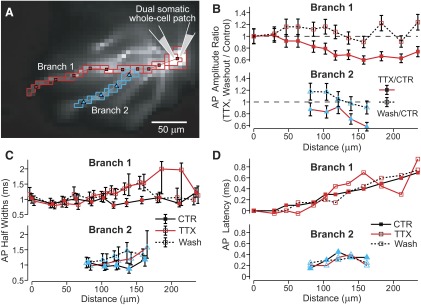
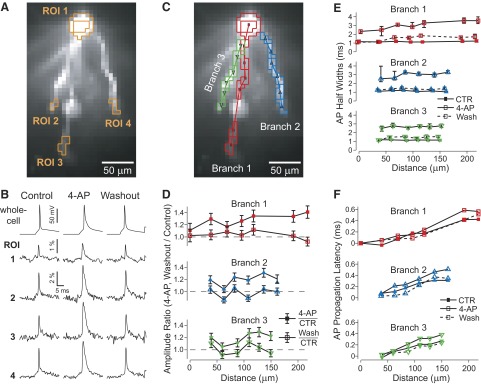
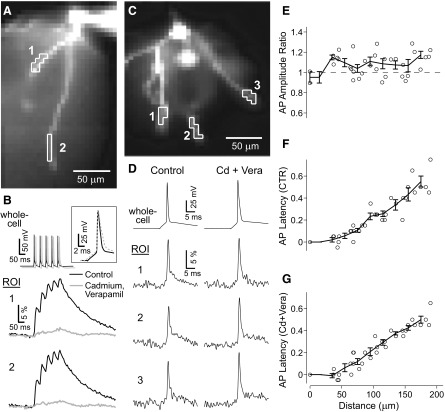
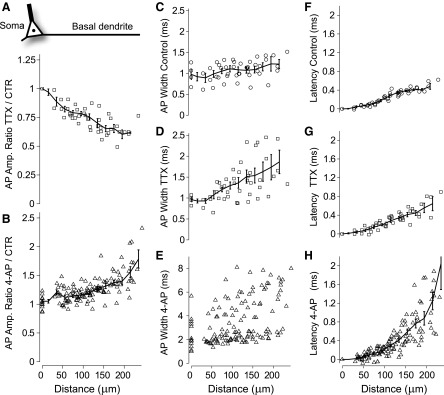
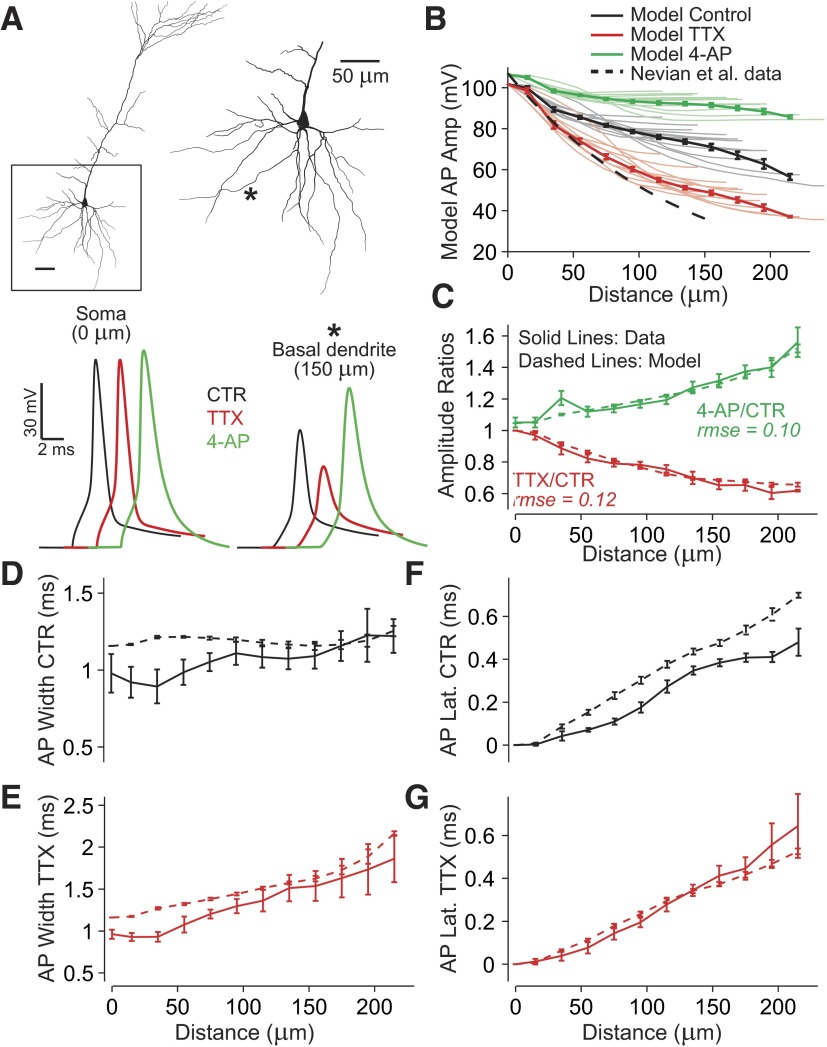
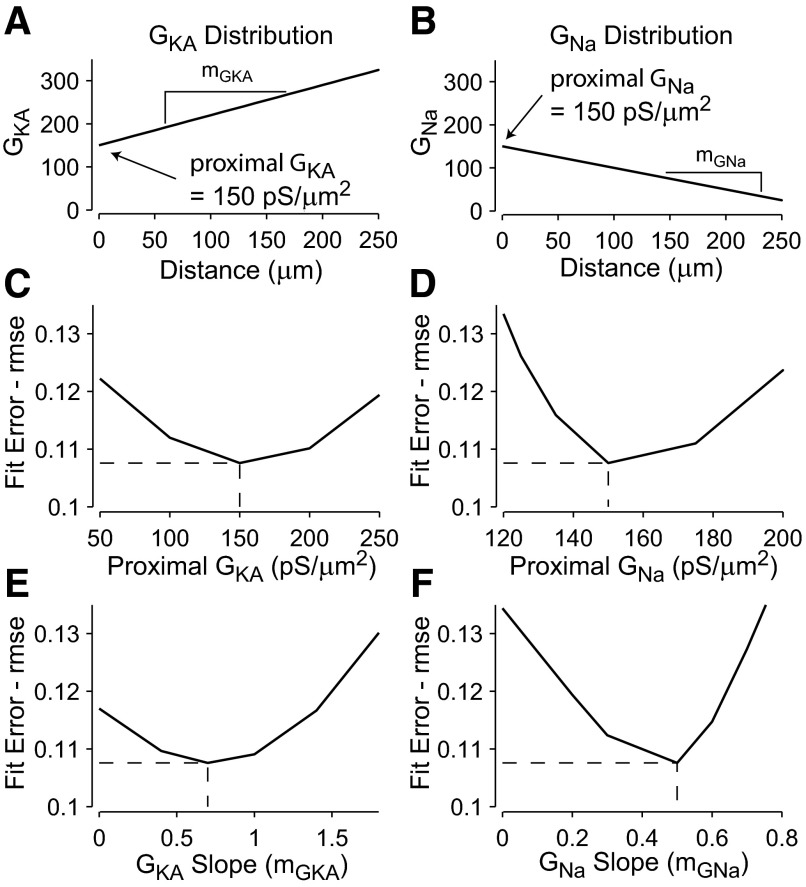
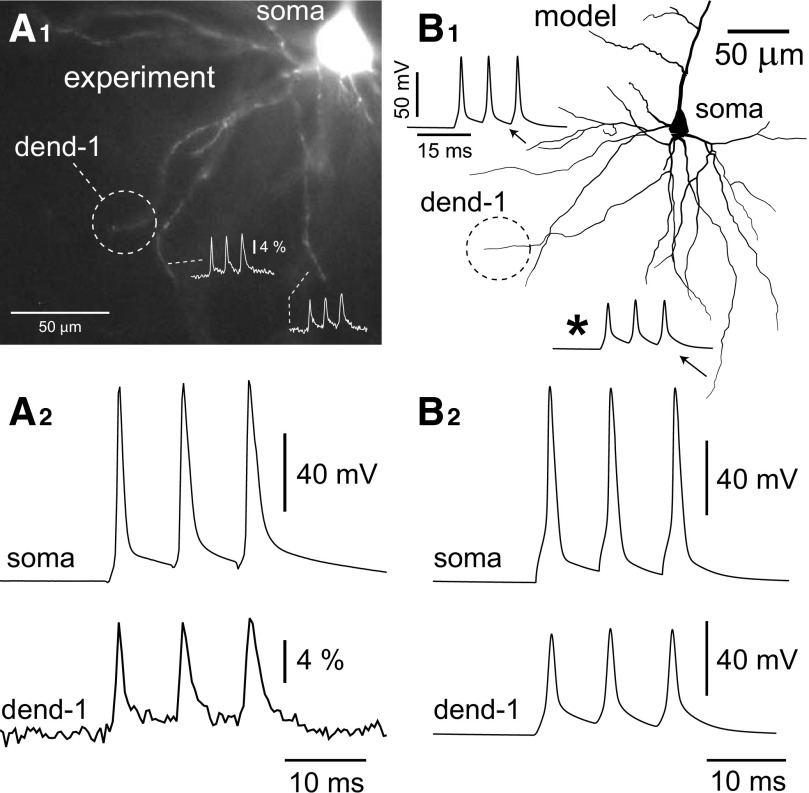
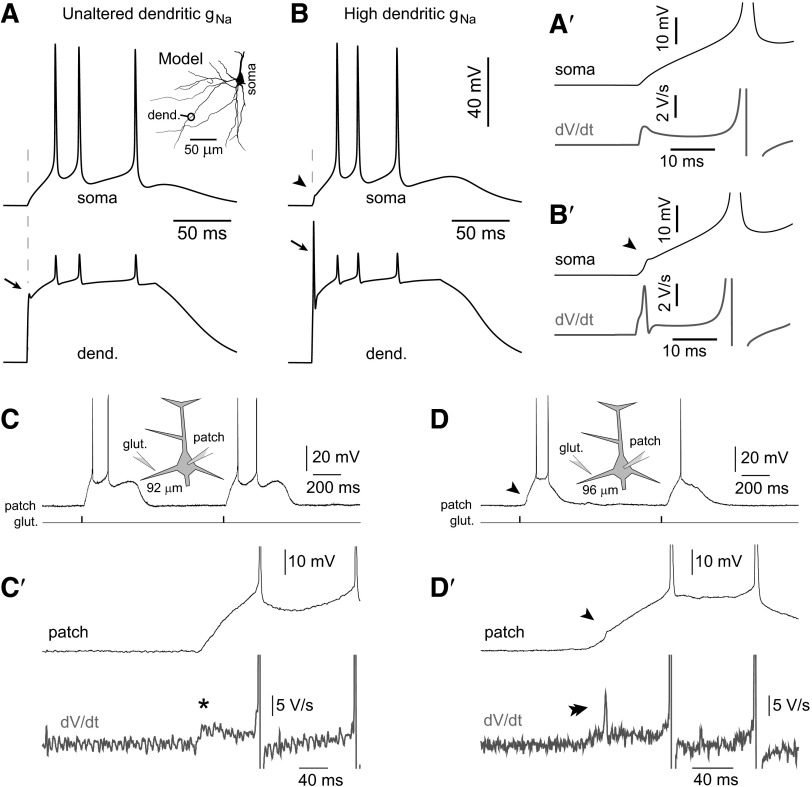
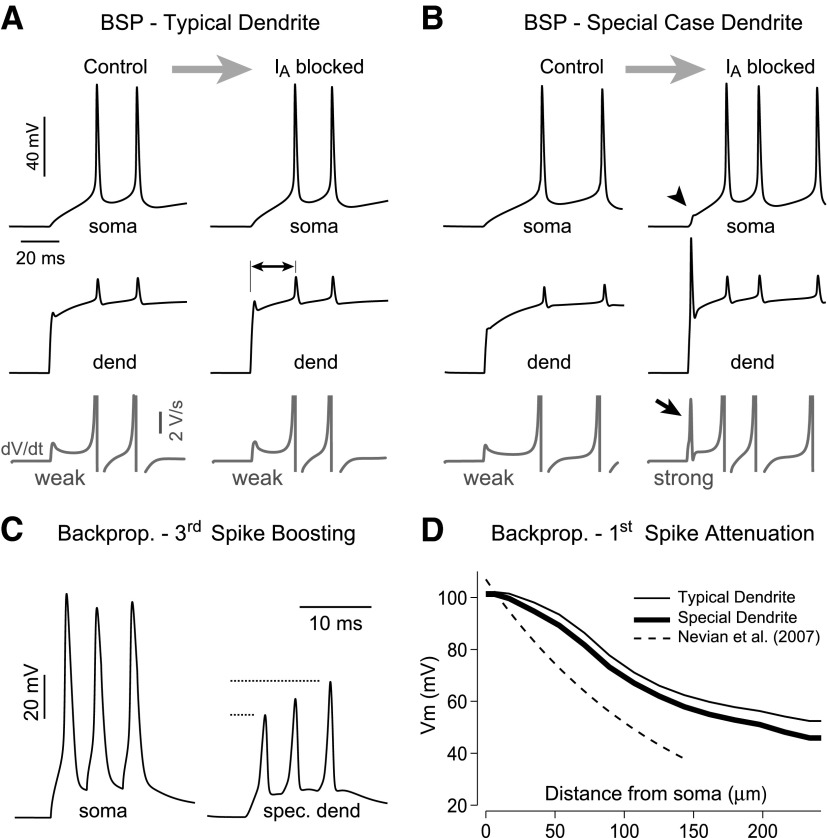
Basal dendrites of prefrontal cortical neurons receive strong synaptic drive from recurrent excitatory synaptic inputs. Synaptic integration within basal dendrites is therefore likely to play an important role in cortical information processing. Both synaptic integration and synaptic plasticity depend crucially on dendritic membrane excitability and the backpropagation of action potentials. We carried out multisite voltage-sensitive dye imaging of membrane potential transients from thin basal branches of prefrontal cortical pyramidal neurons before and after application of channel blockers. We found that backpropagating action potentials (bAPs) are predominantly controlled by voltage-gated sodium and A-type potassium channels. In contrast, pharmacologically blocking the delayed rectifier potassium, voltage-gated calcium, or I(h) conductance had little effect on dendritic AP propagation. Optically recorded bAP waveforms were quantified and multicompartmental modeling was used to link the observed behavior with the underlying biophysical properties. The best-fit model included a nonuniform sodium channel distribution with decreasing conductance with distance from the soma, together with a nonuniform (increasing) A-type potassium conductance. AP amplitudes decline with distance in this model, but to a lesser extent than previously thought. We used this model to explore the mechanisms underlying two sets of published data involving high-frequency trains of APs and the local generation of sodium spikelets. We also explored the conditions under which I(A) down-regulation would produce branch strength potentiation in the proposed model. Finally, we discuss the hypothesis that a fraction of basal branches may have different membrane properties compared with sister branches in the same dendritic tree.


Figures

FIG. 1.
FIG. 1.
Dendritic attenuation of artificially generated somatic action potentials (APs) in the presence of global tetrodotoxin (TTX). A: composite photograph of neuron filled with voltage-sensitive dye JPW1114. B: low-resolution charge-coupled device (CCD) camera was used to sample optical signal inside the box shown in A. The cell body is patched with 2 electrodes. One channel remains in current clamp to monitor membrane potential, necessary to verify the efficacy of the voltage-clamped AP waveform in TTX conditions (methods). Somatic AP amplitude is 109% of Control in TTX and 88% of Control in Washout conditions (45-min washout). Detector sets outlined correspond to 5 regions of interest (ROIs) on 2 basal branches. C: electrical (whole cell) and optical (ROIs 1–5) signals following natural (Control, Washout) or artificially generated somatic APs (block of sodium channels with TTX, 1 μM). Spike-triggered averages, n = 4 sweeps.
FIG. 2.
FIG. 2.
Multisite view of AP backpropagation before, during, and after the block of sodium channels with global TTX. A: same neuron as Fig. 1B with nonoverlapping ROIs. B: amplitudes of averaged AP signals in bath TTX, 1 μM (filled symbols) or Washout conditions (open symbols) divided by amplitudes in Control conditions are plotted for each ROI as a function of distance from the soma. Error bars represent SD of amplitude ratios based on SD of noise and signal amplitude in each condition (methods). C: AP half-widths in Control (filled), TTX (open), and Washout (dashed line) conditions as a function of distance from soma. Error bars reflect uncertainty due to signal noise (methods). D: AP propagation latencies relative to the somatic AP, measured at 90% AP amplitude.
FIG. 3.
FIG. 3.
Quantifying the effect of A-type potassium channels on AP backpropagation in basal dendrites of layer V prefrontal pyramidal cells. A: CCD image of basal dendrites filled with voltage-sensitive dye (VSD) JPW3028. B: spike-triggered average (8 sweeps) of spatially averaged signals from pixels within ROIs outlined in A for Control, 4-aminopyridine (4-AP, 8 mM), and Washout (40 min) conditions. In 4-AP condition we also used synaptic blockers (see methods). C: same image as in A with nonoverlapping ROIs along length of 3 basal branches. D: amplitudes of averaged membrane potential responses in 4-AP or Washout conditions divided by amplitudes in Control conditions (closed, open symbols) are plotted for each ROI as a function of distance from the soma. Error bars as in Fig. 2B. E: AP half-widths in Control, 4-AP, and Washout conditions as a function of distance from soma. Error bars as in Fig. 2C. F: AP propagation latencies relative to the somatic AP, measured at 90% amplitude.
FIG. 4.
FIG. 4.
Disruption of calcium influx has a small effect on voltage waveforms of single backpropagating APs (bAPs). A: pyramidal cell filled with Calcium Green-1. Two ROIs outlined on 2 basal dendrites. B: whole cell recordings during a 20-Hz train of APs, along with optical recordings in Control (black) and after blocking calcium influx (gray) with bath applied cadmium chloride (200 μM) and verapamil (100 μM); average of 6 repetitions. Inset shows first AP in train on an extended timescale. C: image of basal dendrites of a different layer V neuron filled with JPW3028 (400 μM) with 3 ROIs outlined. D: whole cell recordings during single bAPs, along with optical recordings in Control and after blocking calcium influx as in B. All traces are spike-triggered averages of 8 repetitions. EG: pooled data, raw and binned, from 8 dendritic branches from 2 neurons (n = 5 basal dendrites) showing peak AP amplitude ratios (Cadmium + Verapamil over Control, in E), AP propagation latencies in Control (F), and in calcium blockers (Cd + Vera, G).
FIG. 5.
FIG. 5.
Contributions of both sodium and A-type potassium channels to AP amplitude, shape, and velocity. A: amplitude ratios of optical AP waveforms, TTX (1 μM) over Control conditions, as a function of distance from center of soma (see schematic neuron). Mean ratios found by binning data using a sliding boxcar window (error bars are ±SE). B: AP amplitude ratios, 4-AP (8 mM) over Control. CE: AP half-widths as a function of distance from soma in Control, TTX, and 4-AP conditions, respectively. FH: latencies calculated using 90% of peak values in Control, TTX, and 4-AP conditions, respectively. Linear regression indicated that average propagation velocities for distances <250 μm are 0.32, 0.31, and 0.15 m/s in Control, TTX, and 4-AP conditions, respectively. TTX data set (open squares) includes recordings from 46 regions over 7 basal dendritic branches from 4 neurons, whereas the 4-AP data set (open triangles) includes recordings from 179 regions over 24 basal branches from 11 neurons.
FIG. 6.
FIG. 6.
Modeling prefrontal basal dendrites to reproduce multisite AP backpropagation data obtained in Control, TTX, and 4-AP conditions. A: Neurolucida reconstructed layer V pyramidal neuron from the rat prefrontal cortex (P28). Basal arbor is enlarged at right with one example recording location indicated (*). Sample AP waveforms from the soma and * are shown below in Control (CTR, black), after simulated sodium channel block (TTX, red, somatic waveform is reproduced using voltage clamp), or A-type potassium channel block (4-AP, green). Line colors correspond to experiment type in the same way in all panels. A uniform voltage-gated Na+ conductance and a nonuniform K+ conductance (A-type) are chosen along with passive membrane properties to best-fit data (Fig. 7). B: thin lines indicate model AP amplitudes in Control (gray), simulated TTX (red), and 4-AP conditions (green) as a function of distance from soma in individual basal branches in NEURON. In all, 250 locations on 13 model basal dendrites with distinct tips beyond 115 μm are included. Superimposed are binned and averaged data (thick lines). Dashed line, indicating Control AP amplitudes from somatosensory basal dendrites, is shown for comparison [exponential fit from Nevian et al. (2007) experimental patch-clamp data]. C: dashed lines indicate model amplitude ratios TTX/Control or 4-AP/Control, whereas solid lines indicate experimental amplitude ratios. Values of rmse represent root mean squared error between mean model data and experimental data (methods) used to fit the model (Fig. 7). D and E: AP half-widths in Control and TTX conditions as a function of distance from the soma (solid lines = experiment; dashed lines = model). F and G: AP latencies using 90% of peak value crossing times.
FIG. 7.
FIG. 7.
Fit errors used to simultaneously fit model INa and IA conductance distributions to experimental data. A: best-fit A-type potassium conductance rises from a proximal conductance density of 150 pS/μm2 at the interface with the soma (distance = 0 μm) with a slope of 0.7 pS·μm−2·μm−1. B: best-fit sodium conductance declines from a proximal density of 150 pS/μm2 with a slope of 0.5 pS·μm−2·μm−1. CF: overall fit error (average rmse) between data and model is an average of 2 rmse values for amplitude ratios 4-AP/Control and TTX/Control. This overall fit error is plotted as a function of 4 model parameters: the slopes and y-intercepts (proximal to the soma) of the sodium and A-type potassium conductance distributions. The best-fit conductance distributions correspond to the local minimum in overall error values, whereby increasing or decreasing any of the 4 parameters while holding the other 3 constant leads to increased fit error. Sign of the slope of the sodium conductance distribution is reversed for convenience.
FIG. 8.
FIG. 8.
High-frequency trains of action potentials in prefrontal basal dendrites. A1: field of basal dendrites from a layer V prefrontal cortical pyramidal neuron loaded with VSD. High-frequency triplets of APs were elicited by somatic current injection with an 8-ms interstimulus interval (ISI). VSD recordings from tips of basal branches show moderate increases in amplitudes of the 2nd and 3rd action potentials relative to the first (inset). A2: simultaneous somatic whole cell (top) and VSD recordings (bottom) from the basal tip circled in A1 show very little boosting of AP amplitude during the train. B1: neuron model from Fig. 6 with 2 inset “recordings” of AP triplets elicited with 8-ms ISI. There is an increase in amplitude of about 10% between the 1st and 3rd APs in the train at location indicated (*). B2: AP triplet waveforms from the model soma and dendrite marked “dend-1” in B1.
FIG. 9.
FIG. 9.
Modeling the generation of local dendritic spikelets and testing model predictions in experiment. A: response of the soma (top) and dendrite (bottom) to the stimulus (plateau-like conductance; methods) delivered at location indicated in the inset (dend.). All model parameters identical to the best-fit model are shown in Fig. 6 (Unaltered), including proximal dendritic gNa_prox = 150 and gKA_prox = 150 pS/μm2. Initial dendritic spikelet (arrow) has very small amplitude and is not detected in the somatic recording. A′: enlarged view of the somatic membrane potential response near the stimulus onset time along with the first derivative of this response. B: somatic and dendritic responses after boosting the proximal sodium conductance in the stimulating branch to 375 pS/μm2 (slope value maintained at −0.5 pS·μm−2·μm−1). The dendritic spikelet (arrow) is greatly enhanced and causes a fast deflection in the somatic recording (arrowhead), which is easily detectable in the first derivative of the somatic waveform shown in B′. C: diagram of experimental setup with glutamate iontophoresis at basal dendrites and somatic whole cell patch recording. Distance of the glutamate electrode from the center of the soma indicated below the diagram. C′: enlarged view of the somatic membrane potential response to glutamate iontophoresis, along with the first derivative of this response (asterisk). D and D′: same as in C and C′ except a different cell. An initial sharp deflection appears in the somatic recording (arrowhead), which is easily detectable in the first derivative (double arrowhead).
FIG. 10.
FIG. 10.
The role of IA in local dendritic spikes and the possibility for branch strength potentiation (BSP). A: control: all model parameters identical to best-fit model shown in Fig. 6 (Unaltered), including proximal dendritic gNa_prox = 150 and gKA_prox = 150 pS/μm2. Stimulus: same as in Fig. 9, A and B. IA blocked: dendritic A-type conductance set to zero in an attempt to induce BSP (Losonczy et al. 2008). Removal of IA did not result in a significant local dendritic spike potentiation, nor an increase in somatic dV/dt (bottom trace, weak), compared with Control, but it did reduce the latency of the first AP (double-headed arrow). B: proposed model of a special case basal dendrite with increased Na+ and A-type K+ conductances (375 and 1,200 pS/μm2, respectively), where blocking IA does lead to a significant local dendritic spike that is easily detectable in both the somatic waveform (arrowhead) and its first derivative (arrow, strong). C: special case dendrites show much greater “boosting” of dendritic AP amplitudes during high-frequency trains of somatically triggered APs (compared with Fig. 8); more consistent with data from Kampa and Stuart (2006). D: in spite of greatly increased gKA in special case dendrites (gKA = 1,200 pS/μm2), the dendritic amplitudes of the 1st bAP show an attenuation profile similar to that of the best-fit model (Typical Dendrite), which is more moderate than observed experimentally in somatosensory cortex by Nevian et al. (2007).

Similar articles

Cited by

References

    1. Acker CD, White JA. Roles of IA and morphology in action potential propagation in CA1 pyramidal cell dendrites. J Comput Neurosci 23: 201–216, 2007. - PubMed
    1. Antic S, Major G, Zecevic D. Fast optical recordings of membrane potential changes from dendrites of pyramidal neurons. J Neurophysiol 82: 1615–1621, 1999. - PubMed
    1. Antic SD Action potentials in basal and oblique dendrites of rat neocortical pyramidal neurons. J Physiol 550: 35–50, 2003. - PMC - PubMed
    1. Ariav G, Polsky A, Schiller J. Submillisecond precision of the input–output transformation function mediated by fast sodium dendritic spikes in basal dendrites of CA1 pyramidal neurons. J Neurosci 23: 7750–7758, 2003. - PMC - PubMed
    1. Bar-Yehuda D, Ben-Porat H, Korngreen A. Dendritic excitability during increased synaptic activity in rat neocortical L5 pyramidal neurons. Eur J Neurosci 28: 2183–2194, 2008. - PubMed

Publication types

MeSH terms

LinkOut - more resources