. 2008 Dec 31;28(53):14347-57.
doi: 10.1523/JNEUROSCI.4307-08.2008.

Stimulus-induced changes in blood flow and 2-deoxyglucose uptake dissociate in ipsilateral somatosensory cortex

Affiliations

Stimulus-induced changes in blood flow and 2-deoxyglucose uptake dissociate in ipsilateral somatosensory cortex

Anna Devor et al. J Neurosci. .

Abstract

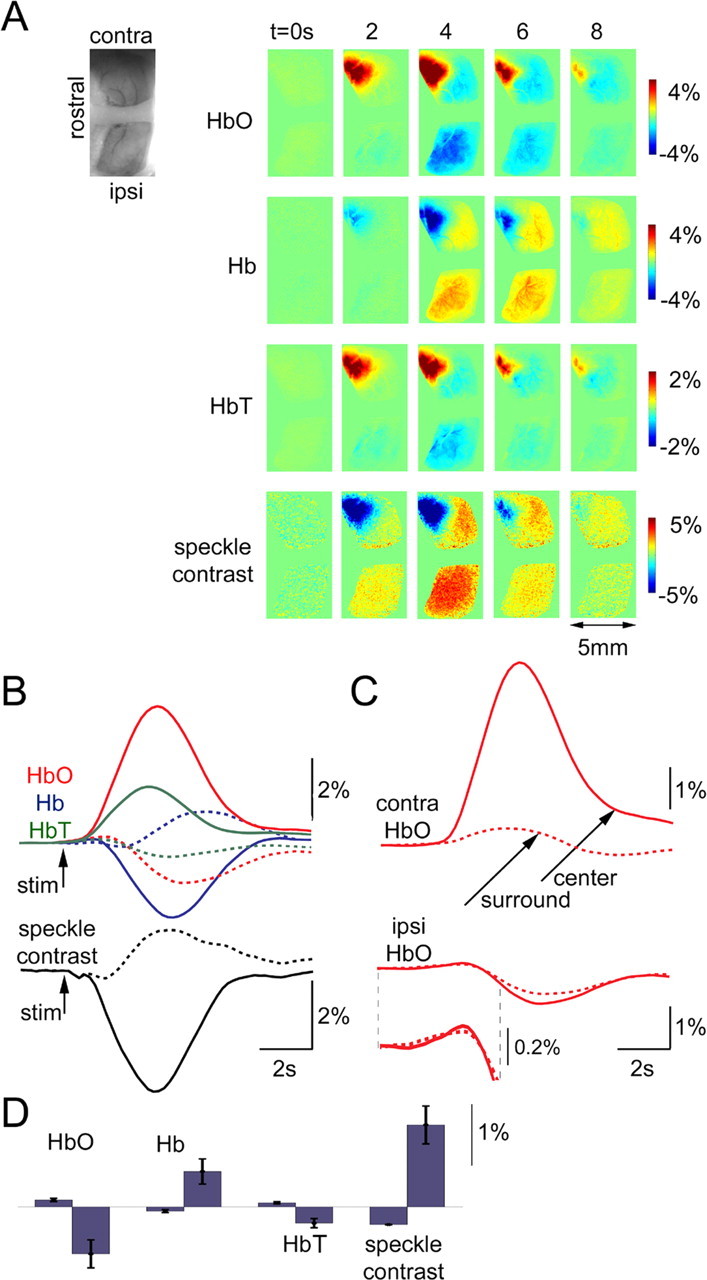
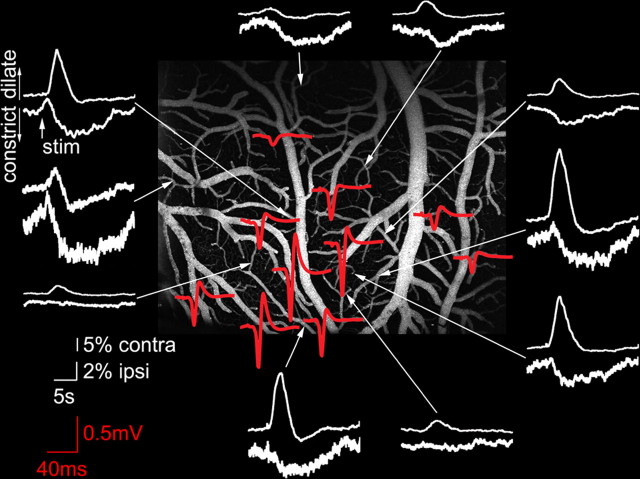
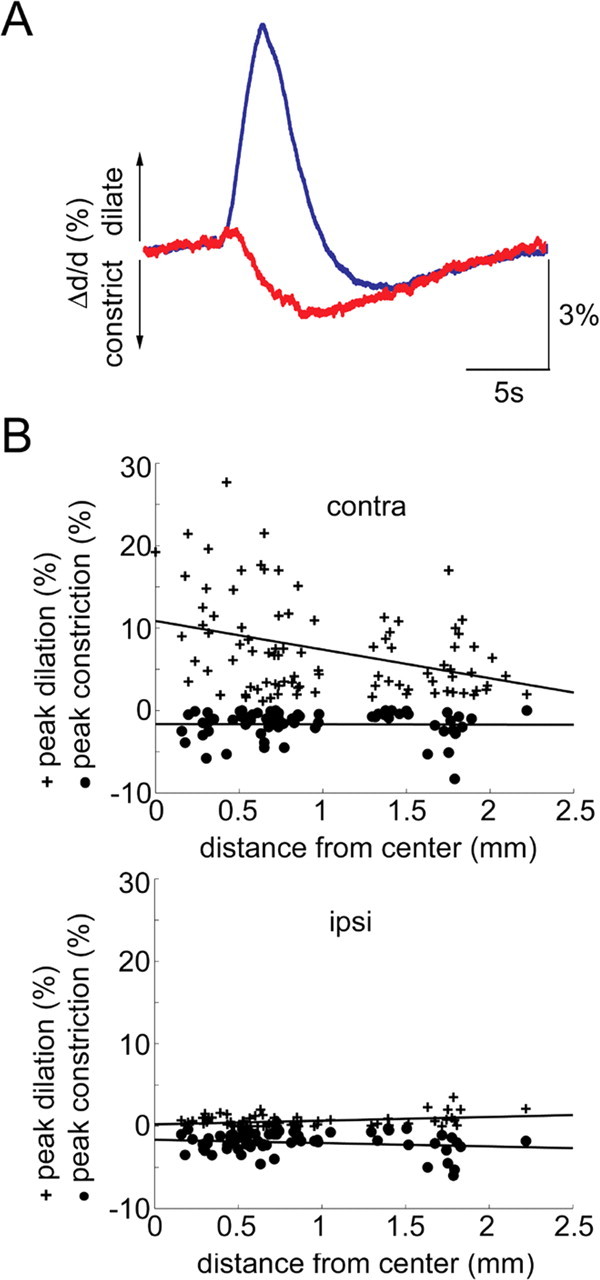
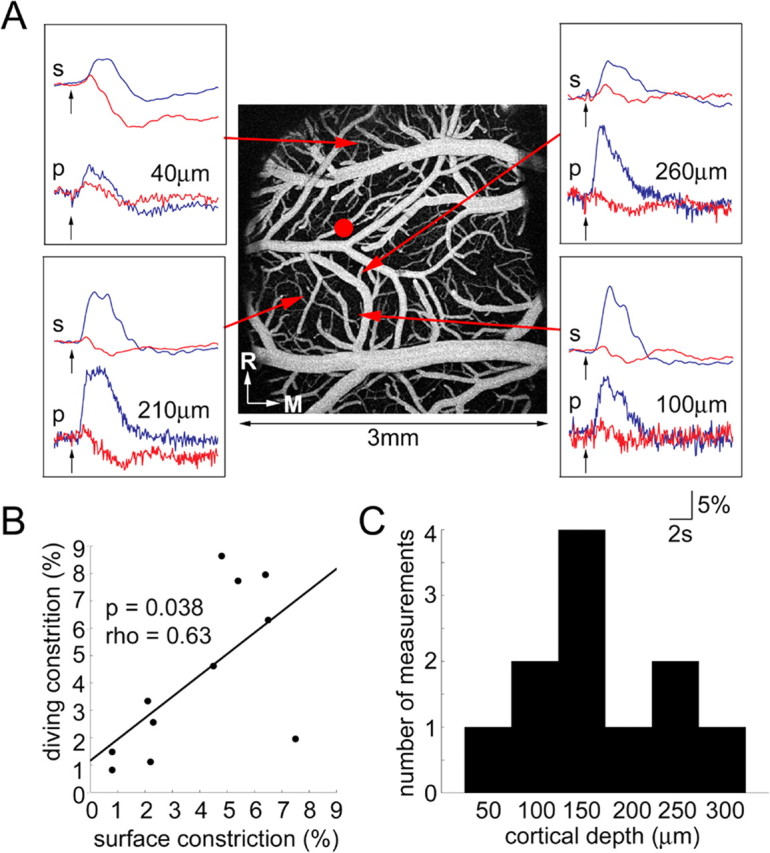
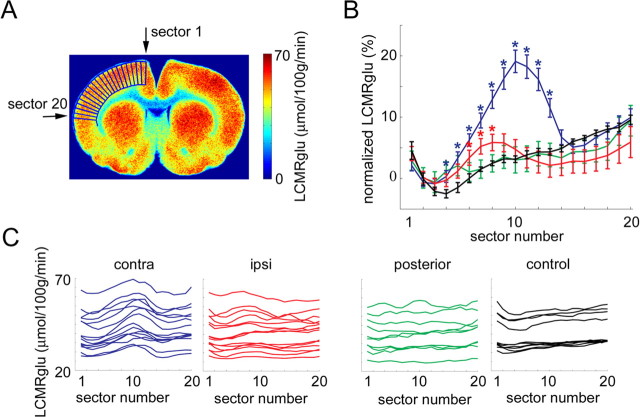
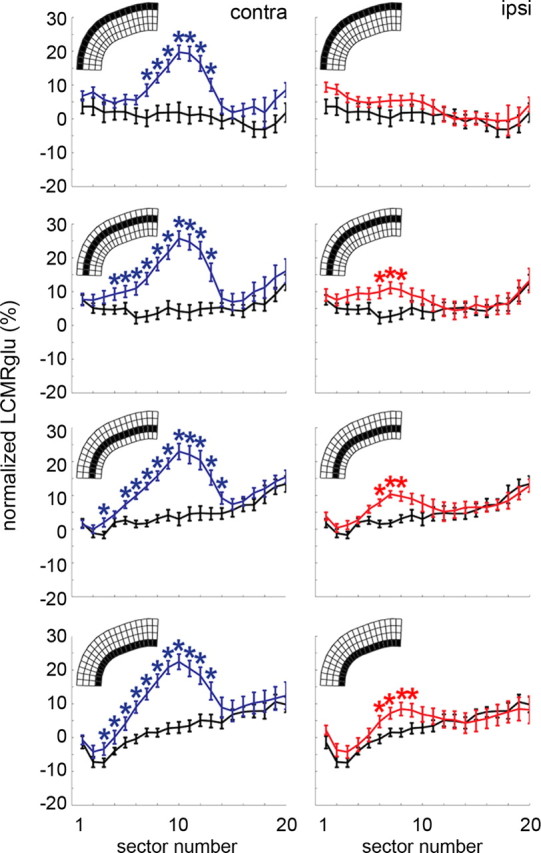
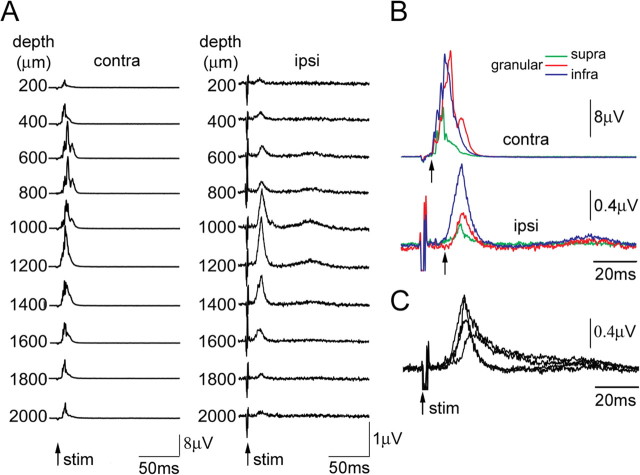
The present study addresses the relationship between blood flow and glucose consumption in rat primary somatosensory cortex (SI) in vivo. We examined bilateral neuronal and hemodynamic changes and 2-deoxyglucose (2DG) uptake, as measured by autoradiography, in response to unilateral forepaw stimulation. In contrast to the contralateral forepaw area, where neuronal activity, blood oxygenation/flow and 2DG uptake increased in unison, we observed, in the ipsilateral SI, a blood oxygenation/flow decrease and arteriolar vasoconstriction in the presence of increased 2DG uptake. Laminar electrophysiological recordings revealed an increase in ipsilateral spiking consistent with the observed increase in 2DG uptake. The vasoconstriction and the decrease in blood flow in the presence of an increase in 2DG uptake in the ipsilateral SI contradict the prominent metabolic hypothesis regarding the regulation of cerebral blood flow, which postulates that the state of neuroglial energy consumption determines the regional blood flow through the production of vasoactive metabolites. We propose that other factors, such as neuronal (and glial) release of messenger molecules, might play a dominant role in the regulation of blood flow in vivo in response to a physiological stimulus.


Figures

Figure 1.
Figure 1.
Bilateral hemodynamic optical imaging reveals a decrease in ipsilateral blood oxygenation and flow. A, HbO, Hb, HbT, and speckle contrast images after stimulus onset (t = 0). The color scale is expressed as percentage signal change relative to prestimulus baseline (ΔC/C0). Time (in seconds) relative to stimulus onset is indicated above the images. One-hundred and fifty trials were averaged. We assumed baseline concentrations of 60 and 40 μm for HbO and Hb, respectively. An image of raw vasculature corresponding to functional frames is shown in the upper left corner. B, Top, Signal time courses extracted from the contralateral (solid lines) and ipsilateral (dashed lines) hemispheres for HbO (red), Hb (blue) and HbT (green). Bottom, The same for speckle contrast. Note that a decrease in speckle contrast indicates an increase in blood flow. C, HbO as in B broken into the center (within a 1.5 mm ring around the center of the response, solid red) and the surround (outside the 1.5 mm ring, dashed red). The center was estimated using the earliest HbT response. Contra, Contralateral to the stimulus hemisphere; ipsi, ipsilateral to the stimulus hemisphere. D, Bar graphs of ΔHbO, ΔHb, ΔHbT, and Δspeckle contrast quantifying the biphasic ipsilateral response. For each measure, the first bar represents the initial (small) oxygenation/flow increase, and the second bar represents the consecutive (big) oxygenation/flow decrease. Data from five subjects were averaged. Error bars indicate SE across subjects. The following are ipsilateral mean ± SE, peaks reported in their temporal order: HbO, 0.11 ± 0.03, −0.75 ± 0.22; Hb, −0.07 ± 0.02, 0.56 ± 0.2; HbT, 0.07 ± 0.02, −0.26 ± 0.07; speckle contrast, −0.28 ± 0.01, 1.3 ± 0.2.
Figure 2.
Figure 2.
Arteriolar diameter change in response to contra and ipsilateral stimulation. White traces show percentage diameter change relative to the baseline (Δd/d) at different locations indicated by arrows. At every location, the upper and lower trace in a pair represents the response to the contra and ipsilateral stimulation, respectively. Dilation is plotted upward; constriction, downward. The center of the neuronal response was mapped on the cortical surface using a ball electrode. Surface potential recordings from different locations are shown in red. The strongest amplitude and fastest rise time indicate the center. The traces are overlaid on a two-photon image of vasculature within the exposure. The image was calculated as a maximum intensity projection of an image stack 0–300 μm in depth. Individual images were acquired every 10 μm. The horizontal dimension is 3.2 mm.
Figure 3.
Figure 3.
Comparison of arteriolar dilatation and constriction in response to contra- and ipsilateral stimulation. A, An average of arteriolar diameter changes (Δd/d) in response to contralateral stimulation (blue) and ipsilateral stimulation (red). All measured vessels from all subjects are averaged. Dilation and constriction are plotted upward and downward, respectively. B, Peak dilation (crosses) and peak constriction (circles) as a function of distance (in micrometers from the center of evoked neuronal response) in response to contralateral stimulation (top) and ipsilateral stimulation (bottom). Each dot represents a measurement from a single arteriole. Data from seven subjects are superimposed.
Figure 4.
Figure 4.
Comparison of surface and diving arterioles. A, Diameter changes (Δd/d) in response to contralateral stimulation (blue) and ipsilateral stimulation (red) at four locations were measured in one subject. At every location, the measurement was made from a parent surface arteriole (s, top pair of traces) and a penetrating (diving) arteriole (p, bottom pair of traces). Dilation and constriction are plotted upward and downward, respectively. Black arrows indicate stimulus onset. Red arrows point to the specific surface arterioles from which the measurements were made. The red circle shows the center of neuronal response. Depth (in μm) is indicated next to each penetrating arteriole. The image of the vasculature was calculated as a maximum intensity projection of an image stack 0–300 μm in depth. Individual images were acquired every 10 μm. B, Peak ipsilateral constriction of diving arterioles as a function of that of a parent surface branch. Amplitude was normalized using dilation in response to the contralateral stimulation. Data from three subjects are superimposed. C, Depth distribution of the measured diving arterioles.
Figure 5.
Figure 5.
2DG autoradiography in response to a unilateral stimulation. A, Sector map used for quantitative analysis is overlaid on a coronal brain section. The color scale is expressed in units of local cerebral metabolic rate of glucose, LCMRglu (μmol/100 g/min). B, Cortical glucose utilization profile as a function of sector number. The direction is from close to the medial ridge (sector 1) to the most lateral point of the hemisphere where the horizontal dimension of the brain is the widest (sector 20). Profiles from the contralateral (blue) and ipsilateral (red) hemispheres, posterior to the active area (green), and control subjects (no stimulus, black) are superimposed. The profiles extracted from each section have been normalized to the mean section intensity before averaging. y-Axis is expressed as percentage change relative to mean section intensity. Data points statistically significant from the control (p < 0.05) are indicated by asterisks. C, Raw (not normalized) profiles extracted from the contralateral hemisphere (blue), the ipsilateral hemisphere (red), posterior to the active area (green), and control subjects (no stimulus, black). Each line represents one hemisphere. Subjects are superimposed on each plot.
Figure 6.
Figure 6.
Laminar distribution of glucose uptake. A cortical glucose utilization profile is shown as a function of sector number in the contralateral hemisphere (left column, blue) and the ipsilateral hemisphere (right column, red). The depth axis of the sector map was divided into four slabs. Each one of the plots shows the profiles extracted from one of the slabs schematically shown in the top left corner. Each data point within a profile was calculated by averaging pixels within each of the sectors in the corresponding slab. Profiles are superimposed onto the baseline at the same depth estimated from the region posterior to the active area (black). The direction of x-axis is as in Figure 5: from close to the medial ridge (sector 1) to the most lateral point of the hemisphere where the horizontal dimension of the brain is the widest (sector 20). The profiles extracted from each section have been normalized to the mean section intensity before averaging. y-Axis is expressed as percentage change relative to mean section intensity. Data points statistically significant from the control (p < 0.05) are indicated by asterisks.
Figure 7.
Figure 7.
Laminar recordings of multiunit activity measure an increase in ipsilateral spiking. A, A laminar profile of MUA response in the contralateral (left panel) and ipsilateral (right panel) hemispheres. The response to the first of the six stimuli in a train is shown. Each trace represents a recording from a single electrode in the array. The corresponding cortical depth is indicated on the left. Recordings from every other contact down to 2000 μm are shown. Five-hundred stimulation trials were averaged. Arrows denote stimulus onset. Note an increase in ipsilateral spiking. B, MUA from supragranular (0–500 μm, green), granular (500–900 μm, red), and infragranular (>900 μm, blue) layers. Black arrows indicate response onset. C, Infragranular MUA responses from four subjects are superimposed.

References

    1. Alonso BdeC, Lowe AS, Dear JP, Lee KC, Williams SC, Finnerty GT (2008) Sensory inputs from whisking movements modify cortical whisker maps visualized with functional magnetic resonance imaging. Cereb Cortex 18:1314–1325. - PMC - PubMed
    1. AttwellD, Iadecola C (2002) The neural basis of functional brain imaging signals. Trends Neurosci 25:621–625. - PubMed
    1. AttwellD, Laughlin SB (2001) An energy budget for signaling in the grey matter of the brain. J Cereb Blood Flow Metab 21:1133–1145. - PubMed
    1. BlancoVM, Stern JE, Filosa JA (2008) Tone-dependent vascular responses to astrocyte-derived signals. Am J Physiol Heart Circ Physiol 294:H2855–H2863. - PMC - PubMed
    1. BresslerD, Spotswood N, Whitney D (2007) Negative BOLD fMRI response in the visual cortex carries precise stimulus-specific information. PLoS ONE 2:e410. - PMC - PubMed

Publication types