

Chapter 13: Imaging of cells and tissues with mass spectrometry: adding chemical information to imaging
- PMID: 19118682
- PMCID: PMC2804930
- DOI: 10.1016/S0091-679X(08)00613-4
Chapter 13: Imaging of cells and tissues with mass spectrometry: adding chemical information to imaging
Abstract
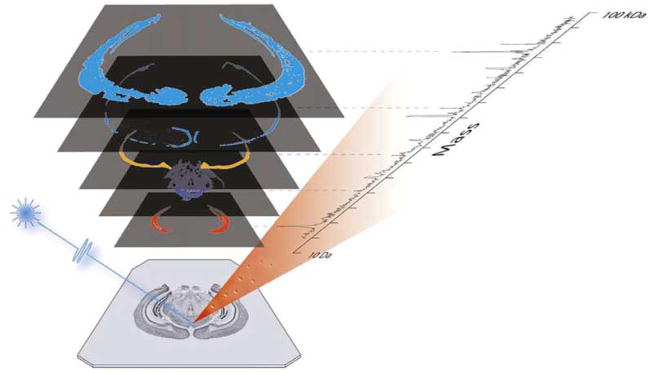
Techniques that map the distribution of compounds in biological tissues can be invaluable in addressing a number of critical questions in biology and medicine. One of the newer methods, mass spectrometric imaging, has enabled investigation of spatial localization for a variety of compounds ranging from atomics to proteins. The ability of mass spectrometry to detect and differentiate a large number of unlabeled compounds makes the approach amenable to the study of complex biological tissues. This chapter focuses on recent advances in the instrumentation and sample preparation protocols that make mass spectrometric imaging of biological samples possible, including strategies for both tissue and single-cell imaging using the following mass spectrometric ionization methods: matrix-assisted laser desorption/ionization, secondary ion, electrospray, and desorption electrospray.
Figures
References
-
- Aerni HR, Cornett DS, Caprioli RM. Automated acoustic matrix deposition for MALDI sample preparation. Anal Chem. 2006;78:827–834. - PubMed
-
- Altelaar AF, Klinkert I, Jalink K, de Lange RP, Adan RA, Heeren RM, Piersma SR. Gold-enhanced biomolecular surface imaging of cells and tissue by SIMS and MALDI mass spectrometry. Anal Chem. 2006;78:734–742. - PubMed
-
- Altelaar AFM, Taban IM, McDonnell LA, Verhaert PDEM, de Lange RPJ, Adan RAH, Mooi WJ, Heeren RMA, Piersma SR. High-resolution MALDI imaging mass spectrometry allows localization of peptide distributions at cellular length scales in pituitary tissue sections. Int J Mass Spectrom. 2007;260:203–211.
-
- Amaya KR, Monroe EB, Sweedler JV, Clayton DF. Lipid imaging in the zebra finch brain with secondary ion mass spectrometry. Int J Mass Spectrom. 2007;260:121–127.
Publication types
MeSH terms
Grants and funding
LinkOut - more resources
Full Text Sources
Other Literature Sources
