. 2009 Jan;5(1):e1000325.
doi: 10.1371/journal.pgen.1000325. Epub 2009 Jan 2.

Adaptive evolution in zinc finger transcription factors

Affiliations

Adaptive evolution in zinc finger transcription factors

Ryan O Emerson et al. PLoS Genet. 2009 Jan.

Abstract

The majority of human genes are conserved among mammals, but some gene families have undergone extensive expansion in particular lineages. Here, we present an evolutionary analysis of one such gene family, the poly-zinc-finger (poly-ZF) genes. The human genome encodes approximately 700 members of the poly-ZF family of putative transcriptional repressors, many of which have associated KRAB, SCAN, or BTB domains. Analysis of the gene family across the tree of life indicates that the gene family arose from a small ancestral group of eukaryotic zinc-finger transcription factors through many repeated gene duplications accompanied by functional divergence. The ancestral gene family has probably expanded independently in several lineages, including mammals and some fishes. Investigation of adaptive evolution among recent paralogs using d(N)/d(S) analysis indicates that a major component of the selective pressure acting on these genes has been positive selection to change their DNA-binding specificity. These results suggest that the poly-ZF genes are a major source of new transcriptional repression activity in humans and other primates.


Conflict of interest statement

The authors have declared that no competing interests exist.

Figures

Figure 1
Figure 1. The Poly-ZF Gene Family Across Species.
Graphical summary of the poly-ZF gene family in several species and groups, arranged roughly in order of divergence from human. Groups analyzed were as follows: bacteria and archaea (entire RefSeq27 protein set for each), plants (O. sativa, A. thaliana), yeasts (S. cerevisiae, S. bayanus, S. castellii, S. kluyveri, S. mikatae), Mosquito (A. gambiae), Fruit Fly (D. melanogaster), Brugia malayi, C. elegans, Sea Urchin (S. purpuratus), Sea Squirt (Ciona intestinalis), Fugu (T. rubripes), Zebrafish (D. rerio), Xenopus (X. tropicalis), Chicken (G. gallus), Cow (B. taurus), Mouse (M. musculus), Human (H. sapiens). The number next to the name of each species or group indicates the number of proteins per species with at least three tandem ZF repeats. The width of the branch leading to each group is proportional to the number of proteins to give a graphical indication of relative gene family size. The cartoon under each name indicates the mean number of tandem ZF repeats in proteins that contain at least three tandem ZF repeats. A blue box is added to the N-terminal end of each cartoon if that group contains any KRAB-ZF proteins.
Figure 2
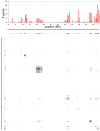
Figure 2. Poly-ZF Genes on Human Chromosome 19.
Top panel: histogram of the number of poly-ZF genes in each 500 kb bin along chromosome 19. Lower panel: dot-plot of identity between poly-ZF proteins. Each dot represents a pair of genes with at least 59% identity. Darker spots represent pairs of genes with higher identity scores. Box-like patterns indicate high similarity between proteins encoded by genes in the same physical cluster.
Figure 3
Figure 3. Example Poly-ZF Alignment.
A protein multiple alignment of the largest human poly-ZF gene expansion, with some sequences removed for clarity (see Methods). Columns with any gaps have been removed. The 9 zinc fingers included in the alignment are outlined in black boxes, and black squares mark the three major nucleotide specificity residues (positions −1, 3 and 6) in each zinc finger. The darkness of the blue background is proportional to amino acid conservation. Below is plotted the posterior mean dN/dS value assigned by Bayes-Empirical-Bayes analysis at each position. The red line represents dN/dS = 1 (no selective pressure), and red stars mark residues at which the hypothesis dN/dS>1 reaches statistical significance (P> = 0.95).
Figure 4
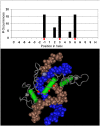
Figure 4. Selection Sites and ZF Structure.
The top panel shows the number of times each position in the ZF α-helix was found to have significant evidence for positive selection by Bayes-Empirical-Bayes analysis. Data were gathered from the largest poly-ZF expansion from each species analyzed (see Methods). The lower panel shows the crystal structure of the first three zinc fingers of Xenopus laevis TFIIIA bound to DNA . Structure is visualized using Cn3D software (http://www.ncbi.nlm.nih.gov/Structure/CN3D/cn3d.shtml). In both parts of the figure, the primary nucleotide-contact residues (−1, 3 and 6 in the helix) are marked by a red dot. On the bottom panel, positions −1, 3 and 6 are ordered from left to right.
Figure 5
Figure 5. dN/dS, Orthologs vs. Expansions.
Plot of the value of dN/dS, averaged over expansion or orthologous fingers. Values for expansion genes are derived from 131 genes from all human and mouse poly-ZF expansions. These genes comprise 25 alignment groups representing 127 gap-free C2H2 zinc fingers. Ortholog values are calculated over 411 genes from 137 sets of mouse, human and cow orthologs, representing 1149 gap-free C2H2 zinc fingers. Each zinc finger site in each alignment was assigned its peak dN/dS value from the 11-class BEB output, and the average of this value over all alignments is plotted. Arrows indicate major nucleotide specificity residues. The systematically higher values among expansion fingers result from a shift in assigned codeml dN/dS classes due to the positively selected sites; they do not indicate relaxed negative selection.
Figure 6
Figure 6. Zinc Finger Diversity.
Above: a logo representation of amino acid diversity among 9,737 zinc fingers collected from human and mouse poly-ZF proteins. Below: a logo constructed from 23,797 zinc fingers collected from the poly-ZF proteins of all major species analyzed. A high bit score on the logo plot reflects invariant residues (C, C, H and H are ascertained to be invariant and so provide a scale for reference). The logo plots are nearly identical, representing the deep conservation of the C2H2 zinc finger motif. Below the logo plots are three charts detailing the amino acid diversity at each of the three major nucleotide specificity residues in the zinc finger. Columns are the frequencies of each amino acid, sorted from highest to lowest at each position. At the bottom is a chart of the frequencies of each triplet of amino acids obtained by combining the residues at −1, 3, and 6, sorted from highest to lowest. The five most frequent triplets are listed in order. See supplemental materials for a table of the amino acid counts and frequencies at each position and for all triplets.

References

    1. Carroll SB, Grenier JK, Weatherbee SD. From DNA to Diversity, 2nd edn. Malden, MA: Blackwell Publishing; 2005.
    1. Lander ES, Linton LM, Birren B, Nusbaum C, Zody MC, et al. Initial sequencing and analysis of the human genome. Nature. 2001;409(6822):860–921. - PubMed
    1. Venter JC, Adams MD, Myers EW, Li PW, Mural RJ, et al. The sequence of the human genome. Science. 2001;291(5507):1304–1351. - PubMed
    1. Urrutia R. KRAB-containing zinc-finger repressor proteins. Genome Biol. 2003;4(10):231. - PMC - PubMed
    1. Bellefroid EJ, Poncelet DA, Lecocq PJ, Revelant O, Martial JA. The evolutionarily conserved Krüppel-associated box domain defines a subfamily of eukaryotic multifingered proteins. Proc Natl Acad Sci U S A. 1991;88(9):3608–3612. - PMC - PubMed