. 2009 Jan;5(1):e1000277.
doi: 10.1371/journal.ppat.1000277. Epub 2009 Jan 2.

The cell adhesion molecule "CAR" and sialic acid on human erythrocytes influence adenovirus in vivo biodistribution

Affiliations

The cell adhesion molecule "CAR" and sialic acid on human erythrocytes influence adenovirus in vivo biodistribution

Elena Seiradake et al. PLoS Pathog. 2009 Jan.

Abstract

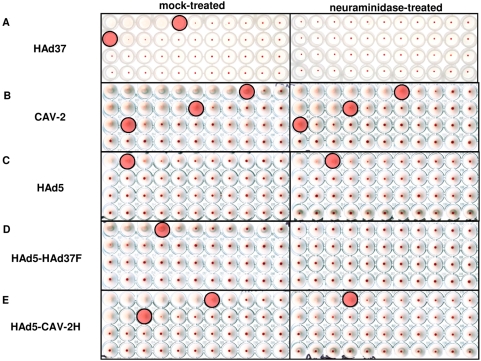
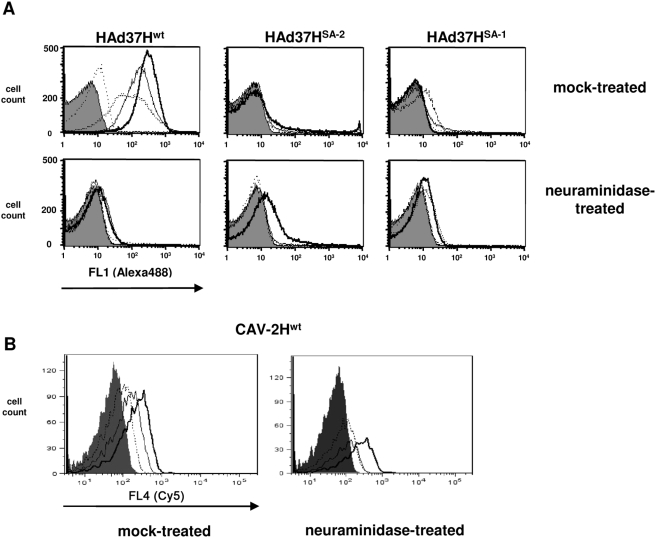
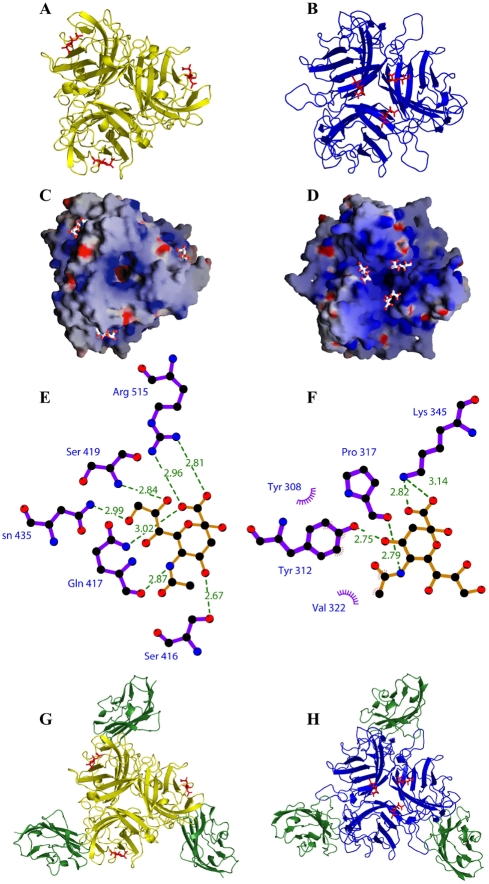
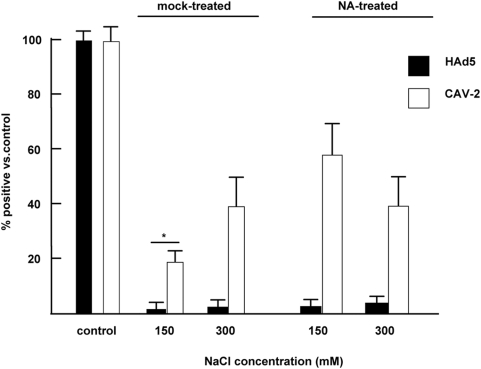
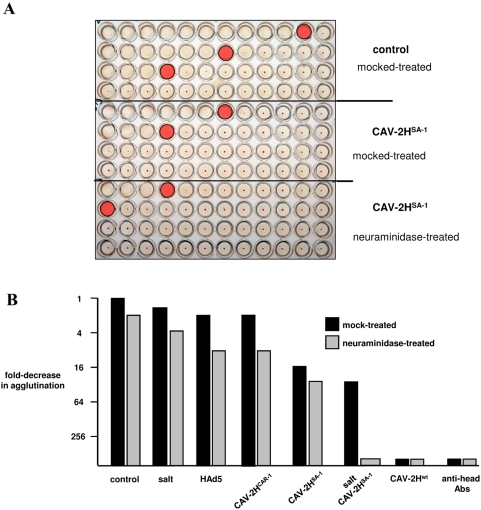
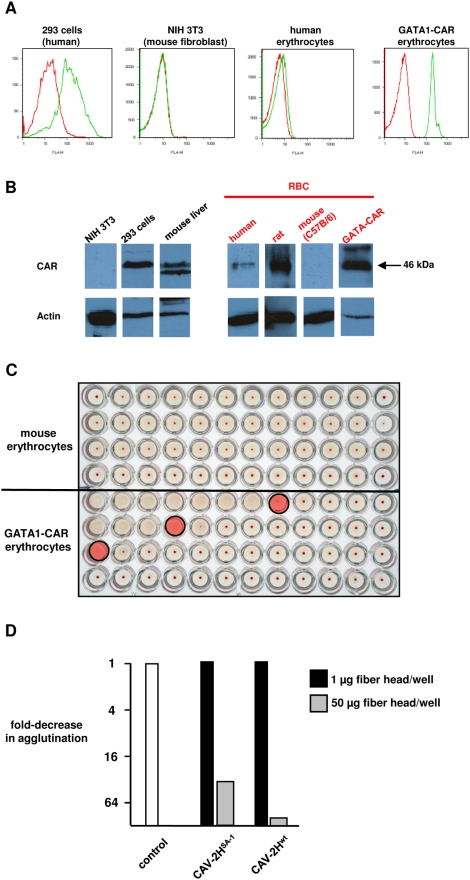
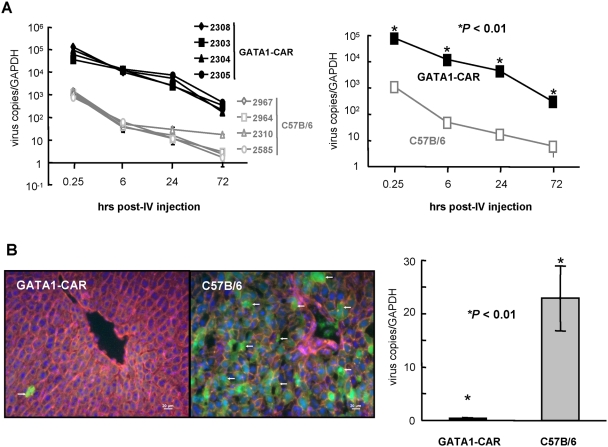
Although it has been known for 50 years that adenoviruses (Ads) interact with erythrocytes ex vivo, the molecular and structural basis for this interaction, which has been serendipitously exploited for diagnostic tests, is unknown. In this study, we characterized the interaction between erythrocytes and unrelated Ad serotypes, human 5 (HAd5) and 37 (HAd37), and canine 2 (CAV-2). While these serotypes agglutinate human erythrocytes, they use different receptors, have different tropisms and/or infect different species. Using molecular, biochemical, structural and transgenic animal-based analyses, we found that the primary erythrocyte interaction domain for HAd37 is its sialic acid binding site, while CAV-2 binding depends on at least three factors: electrostatic interactions, sialic acid binding and, unexpectedly, binding to the coxsackievirus and adenovirus receptor (CAR) on human erythrocytes. We show that the presence of CAR on erythrocytes leads to prolonged in vivo blood half-life and significantly reduced liver infection when a CAR-tropic Ad is injected intravenously. This study provides i) a molecular and structural rationale for Ad-erythrocyte interactions, ii) a basis to improve vector-mediated gene transfer and iii) a mechanism that may explain the biodistribution and pathogenic inconsistencies found between human and animal models.


Conflict of interest statement

The authors have declared that no competing interests exist.

Figures

Figure 1
Figure 1. Hemagglutination assays with HAd37, CAV-2, HAd5 or hybrid capsids.
Mock-treated (left hand column) or neuraminidase-treated (right hand column) erythrocytes (all wells contain the same number of cells) were incubated with serial dilutions (10-fold vertically and 2-fold horizontally) of A. HAd37; B. CAV-2; C. HAd5; D. HAd5-HAd37F, a hybrid capsid containing the HAd37 fiber on the HAd5 capsid; and E. HAd5-CAV-2H, a hybrid capsid containing the CAV-2 fiber head on the HAd5 capsid. Agglutination is visualized by the lack of erythrocyte sedimentation (no red spot) at the bottom of the conical well (see Figure S4 for graphic description). The pink shaded well is the first well that does not significantly agglutinate. All assays were performed at least three times.
Figure 2
Figure 2. Binding of wild type and mutant fiber heads to human erythrocytes.
A. HAd37 fiber head binding to erythrocytes (mock-treated, top panels or neuraminidase-treated, bottom panels) as measured by flow cytometry. The shadowed profile = mock-treated erythrocytes without fiber heads. The line graphs correspond to four 10-fold dilutions (13, 1.3, 0.13 and 0.013 mM) of three HAd37 fiber heads: HAd37wt = wild type, HAd37SA−1 and HAd37SA−2 contain mutations in the HAd37H sialic acid binding domain. The lowest dilution (0.013 mM = the dotted line in the top left panel. The darkest line (furthest to the right in the top left panel) = 13 mM. Except for the modest binding of 13 mM HAd37SA−2 to neuraminidase-treated cells (bottom row middle panel), no other notable binding could be detected and therefore the line profiles overlap or are hidden by the shadowed mock-treated profile. B. Fluorescently-labeled CAV-2 fiber head (CAV2Hwt) binding to mock-treated (left) or neuraminidase-treated (right) erythrocytes as measured by flow cytometry. Three 10-fold dilutions of CAV2Hwt (13, 1.3 and 0.13 mM) covalently labeled with Cy5 were assayed. The shadowed profile = mock-treated erythrocytes without fiber heads. As above the highest concentration of fiber head is in the darkest line profile. All assays were performed at least twice in triplicate.
Figure 3
Figure 3. Structure of the CAV-2 fiber head in complex with sialic acid and CAR.
A. Ribbon diagram of CAV-2 fiber head in complex with sialyl-D-lactose (red = Neu5AC, yellow = fiber head). B. Cartoon representation of HAd37 fiber head in complex with sialyl-D-lactose (red = sialic acid, blue = fiber head). C. Surface charge representation of CAV-2 fiber head and cartoon representation of sialic acid as found in the complex. D. Surface charge representation of HAd37 fiber head and cartoon representation of sialic acid as found in the complex. E. Representation of the contacts between CAV-2 fiber head (purple) and sialic acid (yellow). F. Representation of the contacts between HAd37 fiber head (purple) and Neu5AC (yellow). G. Ribbon diagram of CAV-2 fiber head in complex with CAR D1 and sialyl-D-lactose (red = Neu5AC, green = CAR, yellow = fiber head). H. Ribbon diagram of HAd37 fiber head in complex with CAR and sialyl-D-lactose (red = Neu5AC, green = CAR, blue = fiber head).
Figure 4
Figure 4. HAd5 and CAV-2 binding to human erythrocyte.
CAVGFP or AdGFP was incubated with 2.5×10⁷ erythrocytes at 1 particle per cell (equivalent to ∼5×10⁹ pp in 1 ml of blood) in PBS and ± additional NaCl. The erythrocytes were pelleted by slow speed centrifugation, and an aliquot of the supernatant was removed and incubated with a monolayer of the most permissive and sensitive cells (911 cells for AdGFP and DKCre cells for CAVGFP). These latter cells were analyzed for GFP expression by flow cytometry 24 hr post-incubation. The percent of GFP+ cells versus the control is shown for mock- or neuraminidase-treated erythrocytes. All samples are significantly (P<0.05) different from the controls. In addition, the star (*) corresponds to a P value of <0.01 between the mock-treated erythrocytes at physiologically relevant salt concentration (150 mM) and the controls.
Figure 5
Figure 5. CAV-2 hemagglutination assays using competition with fiber heads, ± increased salt concentrations and ± neuraminidase.
A. Examples of the results from competition assay (see Figure S4 for the schema of the approach). The pink shaded well corresponds to the last well that shows agglutination. A shift to the left of the pink shade signifies decreased agglutination due to blocking of the virus binding site or removal of an attachment ligand. A 2-fold decrease in agglutination would correspond to a one-well shift to the left of the last well that showed agglutination. Top control panel = agglutination of human erythrocytes by CAV-2 (for example ∼8 pp/erythrocyte in the pink shaded well on top row). Middle panel = erythrocytes preincubated with CAV-2HSA−1 (the CAV-2 fiber head that contains a mutation in the sialic acid binding site but can still bind CAR) prior to the agglutination assay (∼96 pp/erythrocyte in the pink shaded well, top row), which equals an ∼8 to 16-fold decrease from the control). Bottom panel = the same as the middle panel except that the erythrocytes were pretreated with neuraminidase (16 to 32-fold decrease). B. The graph shows the cumulative data from competition assays. CAV-2- agglutination of mock-treated erythrocytes was used as the starting point. The blocking agent was used with mock (black bars) or neuraminidase-treated (grey bars) erythrocytes. All assays were performed at least three times.
Figure 6
Figure 6. CAR expression by erythrocytes leads to CAV-2 induced agglutination.
A. Flow cytometry analysis of CAR expression by human, mouse and GATA1-CAR mouse erythrocytes using the anti-CAR E1.1, which recognizes the native form of CAR. B. Western blot analysis of CAR expression using the polyclonal anti-CAR antibody CAR1605, which recognizes the denatured form of CAR: murine fibroblast (NIH 3T3 cells, CAR), human embryonic kidney cells (293 cells, CAR+) and mouse liver (CAR+), and human, rat, mouse (C57BL/6) and GATA1-CAR mouse erythrocytes. An anti-actin staining was used to control the protein input. C. Hemagglutination assay using C57BL/6 and GATA1-CAR mouse erythrocytes. No significant agglutination was found with C57BL/6 mice while GATA1-CAR erythrocytes agglutinated with ∼3 pp of CAV-2/erythrocyte (pink shaded wells). D. Hemagglutination competition assay using GATA-CAR erythrocytes and performed as described in Figure 5 using a higher concentration of the fiber head (as would be expected due to the higher levels of CAR on GATA-CAR erythrocytes).
Figure 7
Figure 7. Biodistribution of CAR-tropic HAd5 in GATA1-CAR mice.
Mice were injected intravenously with an HAd5 vector expressing GFP (AdGFP) and blood and livers were recovered at the indicated times and assayed for vector genomes and/or GFP expression. A. qPCR of viral genomes in the blood at ∼15 min (0.25 hr), 6 hr, and 1 and 3 days post-injection normalized by copies of GAPDH for each mouse (four GATA1-CAR and four C57B/6 mice, the isogenic strain) (left hand panel) and the mean of each group (right hand panel). qPCR was performed twice in triplicate. B. Histological section from the liver of representative mice at day 3 (72 hr). GFP expression from AdGFP is indicated by the green cells (white arrows). The sections were stained with Hoechst to show the nuclei (in blue) and phalliodin-TRITC to show actin filaments (red, or yellow if an overlap with GFP signal) (left-hand panel). qPCR analysis of the viral genomes in the livers of four GATA1-CAR and four C57BL/6 mice at day 3 (right hand panel). qPCR was performed twice in triplicate.

Similar articles

Cited by

References

    1. Cusack S. Adenovirus complex structures. Curr Opin Struct Biol. 2005;15:237–243. - PubMed
    1. Gelderblom H, Maichle-Lauppe I. The fibers of fowl adenoviruses. Arch Virol. 1982;72:289–298. - PubMed
    1. Zhang Y, Bergelson JM. Adenovirus receptors. J Virol. 2005;79:12125–12131. - PMC - PubMed
    1. Albinsson B, Kidd AH. Adenovirus type 41 lacks an RGD alpha(v)-integrin binding motif on the penton base and undergoes delayed uptake in A549 cells. Virus Res. 1999;64:125–136. - PubMed
    1. Soudais C, Boutin S, Hong SS, Chillon M, Danos O, et al. Canine adenovirus type 2 attachment and internalization: coxsackievirus-adenovirus receptor, alternative receptors, and an RGD-independent pathway. J Virol. 2000;74:10639–10649. - PMC - PubMed

Publication types

Substances