. 2009 Mar;197(1):77-86.
doi: 10.1016/j.jmr.2008.12.009. Epub 2008 Dec 14.

High-resolution 1H MAS RFDR NMR of biological membranes

Affiliations

High-resolution 1H MAS RFDR NMR of biological membranes

Darryl Aucoin et al. J Magn Reson. 2009 Mar.

Abstract

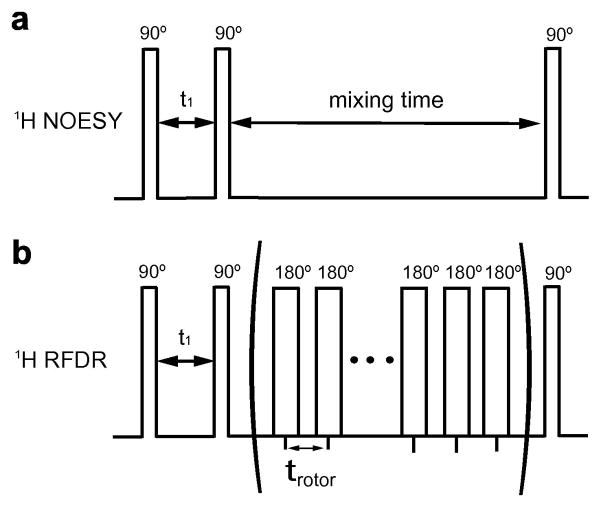
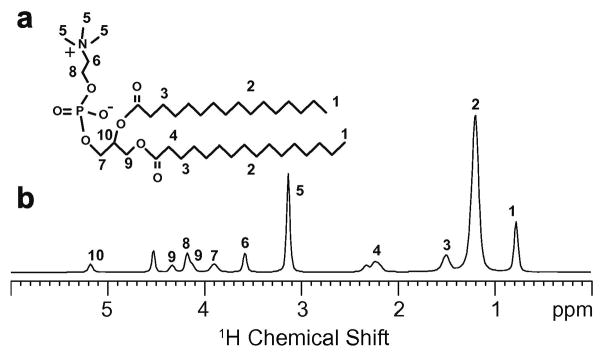
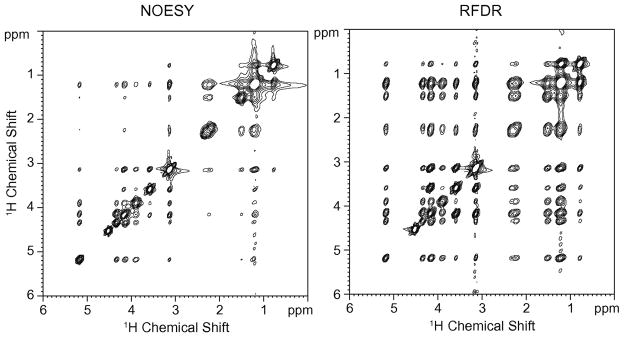
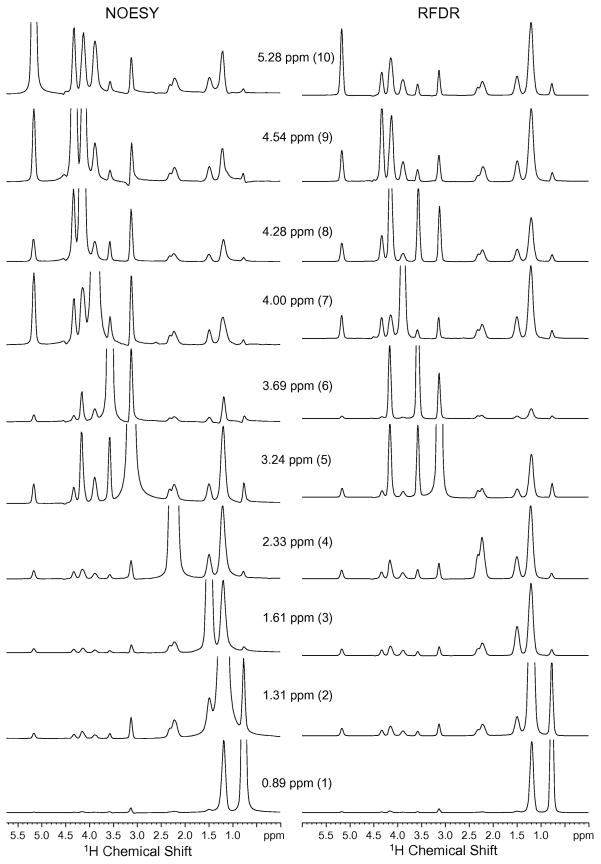
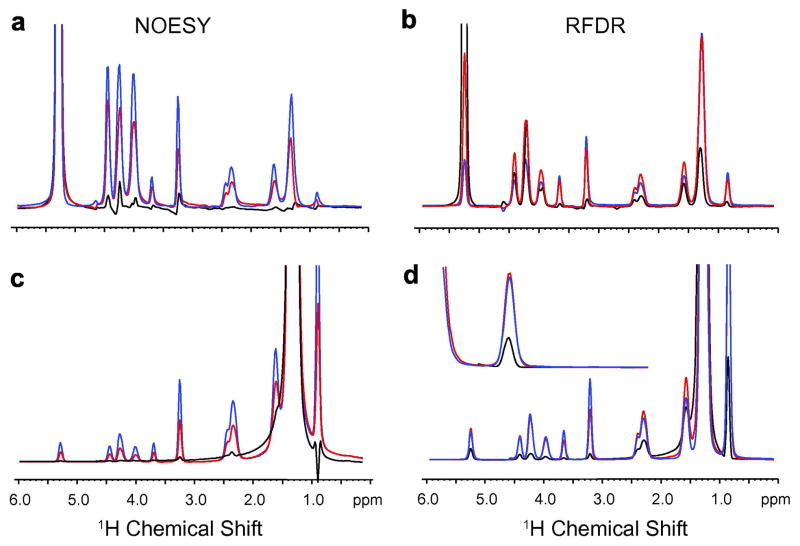
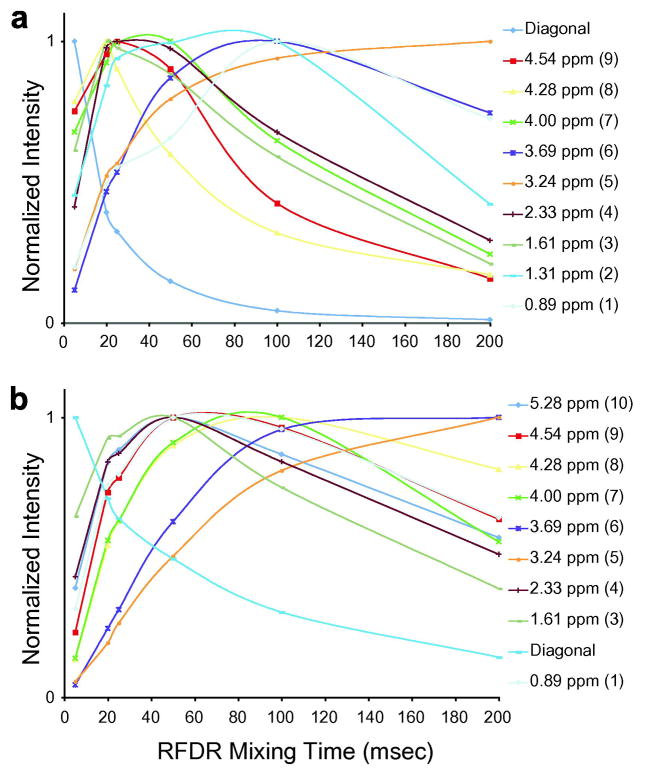
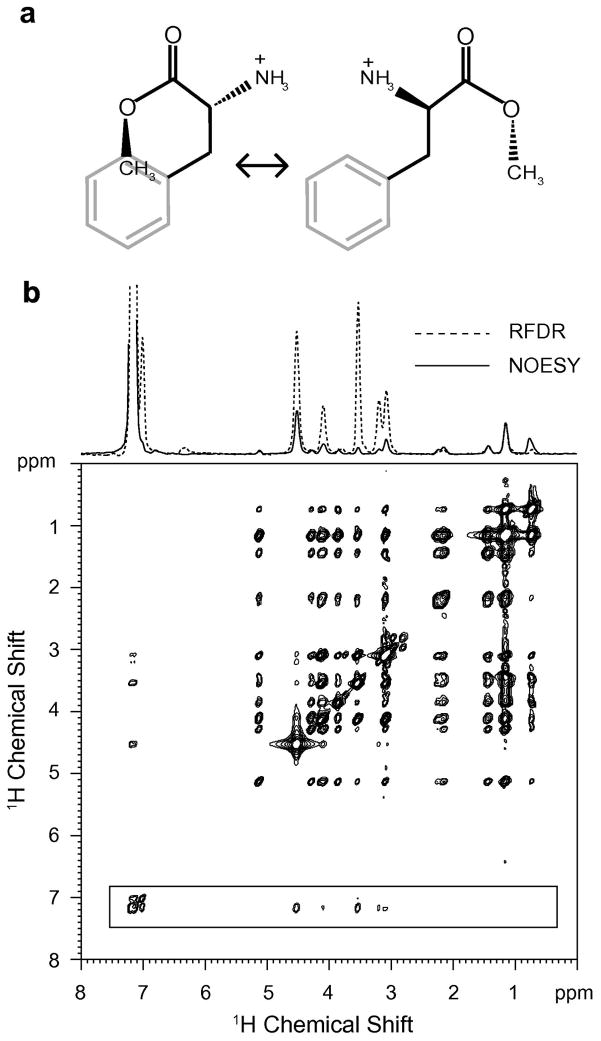
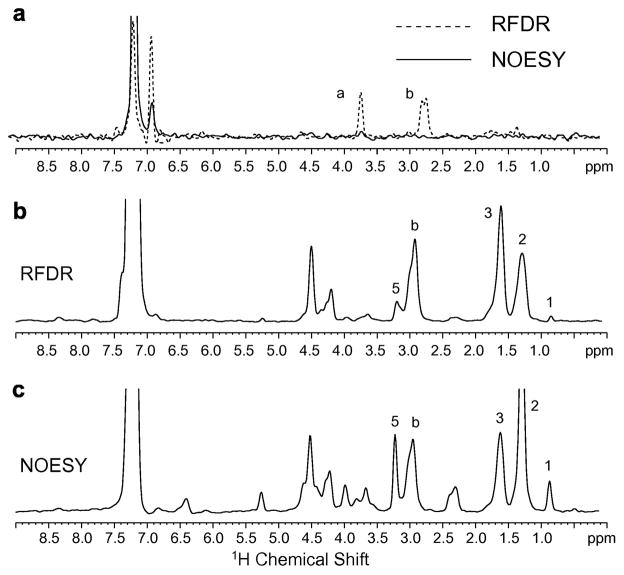
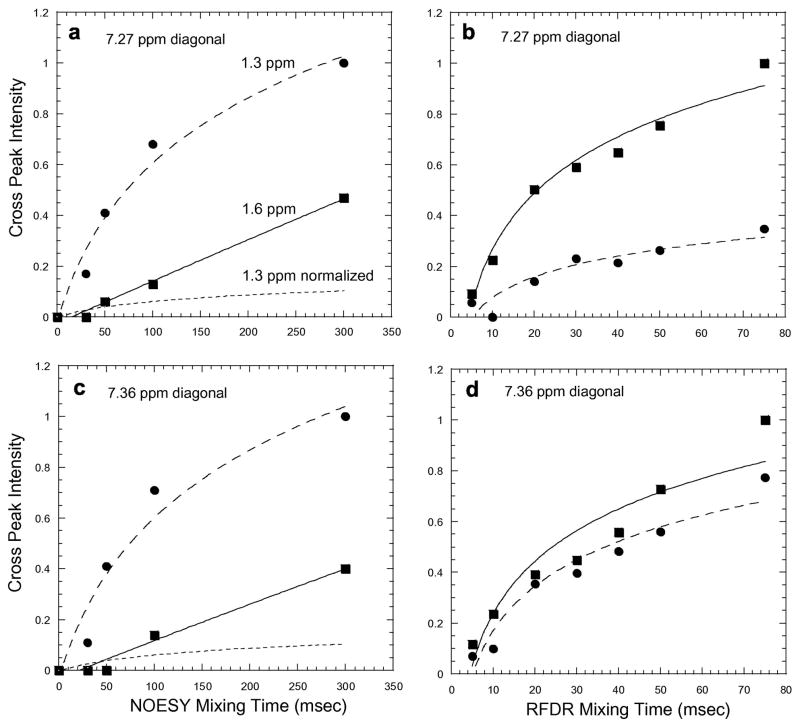
The combination of magic angle spinning (MAS) with the high-resolution (1)H NOESY NMR experiment is an established method for measuring through-space (1)H...(1)H dipolar couplings in biological membranes. The segmental motion of the lipid acyl chains along with the overall rotational diffusion of the lipids provides sufficient motion to average the (1)H dipolar interaction to within the range where MAS can be effective. One drawback of the approach is the relatively long NOESY mixing times needed for relaxation processes to generate significant crosspeak intensity. In order to drive magnetization transfer more rapidly, we use solid-state radiofrequency driven dipolar recoupling (RFDR) pulses during the mixing time. We compare the (1)H MAS NOESY experiment with a (1)H MAS RFDR experiment on dimyristoylphosphocholine, a bilayer-forming lipid and show that the (1)H MAS RFDR experiment provides considerably faster magnetization exchange than the standard (1)H MAS NOESY experiment. We apply the method to model compounds containing basic and aromatic amino acids bound to membrane bilayers to illustrate the ability to locate the position of aromatic groups that have penetrated to below the level of the lipid headgroups.


Figures

Fig. 1
Fig. 1
1H NOESY and RFDR pulse sequences. The simple NOESY experiment consists of three 90° pulses. In the 1H MAS RFDR experiment, a series of π-pulses are introduced during the mixing time synchronized with the rotor frequency. In both experiments, the first 90° pulse creates transverse magnetization that evolves under the influence of the isotropic chemical shift during the first delay. The second 90° pulse rotates the magnetization back to the z axis. Magnetization exchange takes place during the mixing time.
Fig. 2
Fig. 2
Molecular structure (a) and 1H MAS spectrum (b) of DMPC. The assignments of the resonances to specific protons of DMPC are indicated [1, 30].
Fig. 3
Fig. 3
Comparison of 2D 1H MAS NOESY (left) and RFDR (right) spectra of DMPC bilayers. The spectra were obtained using a mixing time of 50 msec. The DMPC sample was hydrated with D2O. The MAS frequency was 7 kHz.
Fig. 4
Fig. 4
Comparison of crosspeak intensities from 2D 1H MAS NOESY (left column) and RFDR (right column) spectra of DMPC. Rows are shown from the 2D spectra in Fig. 3. The spectra were obtained using a mixing time of 50 msec. The MAS frequency was 7 kHz.
Fig. 5
Fig. 5
Buildup of crosspeak intensity of DMPC bilayers in the 1H MAS NOESY (dashed line) and RFDR (solid-line) experiments. The intensities are normalized to 1 and plotted as a function of the mixing time from 0 to 200 msec.
Fig. 6
Fig. 6
Dependence of crosspeak intensity on mixing time for the 1H MAS NOESY and 1H MAS RFDR experiments. For the NOESY experiment, rows are shown through peak 10 (a) and peak 2 (c) for mixing times of 5 (black), 50 (red) and 100 (blue) msecs. The corresponding rows are shown for the RFDR experiment in (b) and (d). The inset corresponds to the crosspeak at 0.89 ppm.
Fig. 7
Fig. 7
Buildup of crosspeak intensity in the RFDR experiment for the glycerol proton at 5.28 ppm (a) and the acyl chain protons at 1.3 ppm (b). The buildup curves are shown for mixing times from 0–200 msecs.
Fig. 8
Fig. 8
Molecular structure (a) and comparison of 1H MAS NOESY and 1H MAS RFDR spectra (b) of phenylalanine methyl ester bound to DMPC:DMPG bilayers. The 2D 1H MAS RFDR spectrum obtained with a 50 msec mixing time is shown. Above the spectrum are rows obtained through the aromatic protons of the phenylalanine ring comparing 1H MAS NOESY (solid line) with 1H MAS RFDR (dashed line) for the same mixing time and number of scans. For these experiments, the DMPC:DMPG molar ratio was 10:3 and the molar ratio of total lipid to phenylalanine methyl ester was 10:1.
Fig. 9
Fig. 9
Comparison of 1H MAS NOESY and 1H MAS RFDR spectra of Ac-KKKFSFKKK-OMe. (a) Peptide bound to deuterated (D67) DMPC bilayers. Rows through the diagonal resonance of the aromatic phenylalanine ring proton resonance at 7.11 ppm are shown comparing 1H MAS NOESY (solid line) with 1H MAS RFDR (dashed line) for the same mixing time (50 msec) and number of scans. The intramolecular crosspeaks to the Cα-H and CβH protons of phenylalanine dominate the 1H MAS RFDR spectrum. The peptide-to-lipid molar ratio was 1:20. (b) Peptide bound to DMPC:DMPG bilayers using 1H MAS RFDR with a mixing time of 50 msec. The row through the diagonal resonance of the aromatic phenylalanine ring protons at 7.11 ppm shows the correlations to the lipid protons. (c) Peptide bound to DMPC:DMPG bilayers using 1H MAS NOESY with a mixing time of 300 ms. The same row as in (b) is shown through the diagonal resonance of the aromatic phenylalanine ring protons at 7.11 ppm.
Fig. 10
Fig. 10
Buildup of crosspeak intensity in the 1H MAS NOESY (a,c) and RFDR (b,d) experiments for the acyl chain protons at 1.3 ppm (dashed line, circles) and 1.6 ppm (solid line, squares). The error in the measurement of crosspeak intensity due to noise in the 2D spectra is represented by size of the symbols (circles, squares). The noise and corresponding error is the same at all mixing times. Normalization of the NOESY crosspeak intensities in Figs. 10a and 10c is indicated by dashed black lines.

References

    1. Oldfield E, Bowers JL, Forbes J. High-resolution proton and carbon-13 NMR of membranes: why sonicate? Biochemistry. 1987;26:6919–6923. - PubMed
    1. Holte LL, Gawrisch K. Determining ethanol distribution in phospholipid multilayers with MAS-NOESY spectra. Biochemistry. 1997;36:4669–4674. - PubMed
    1. Yau WM, Wimley WC, Gawrisch K, White SH. The preference of tryptophan for membrane interfaces. Biochemistry. 1998;37:14713–14718. - PubMed
    1. Davis JH, Auger M, Hodges RS. High resolution 1H nuclear magnetic resonance of a transmembrane peptide. Biophys J. 1995;69:1917–1932. - PMC - PubMed
    1. Bouchard M, Davis JH, Auger M. High-speed magic angle spinning solid-state 1H nuclear magnetic resonance study of the conformation of gramicidin A in lipid bilayers. Biophys J. 1995;69:1933–1938. - PMC - PubMed

Publication types

LinkOut - more resources