Comparative Study
. 2009 Feb 27;104(4):541-9.
doi: 10.1161/CIRCRESAHA.108.182998. Epub 2009 Jan 2.

Proinflammatory phenotype of perivascular adipocytes: influence of high-fat feeding

Affiliations
Comparative Study

Proinflammatory phenotype of perivascular adipocytes: influence of high-fat feeding

Tapan K Chatterjee et al. Circ Res. .

Abstract

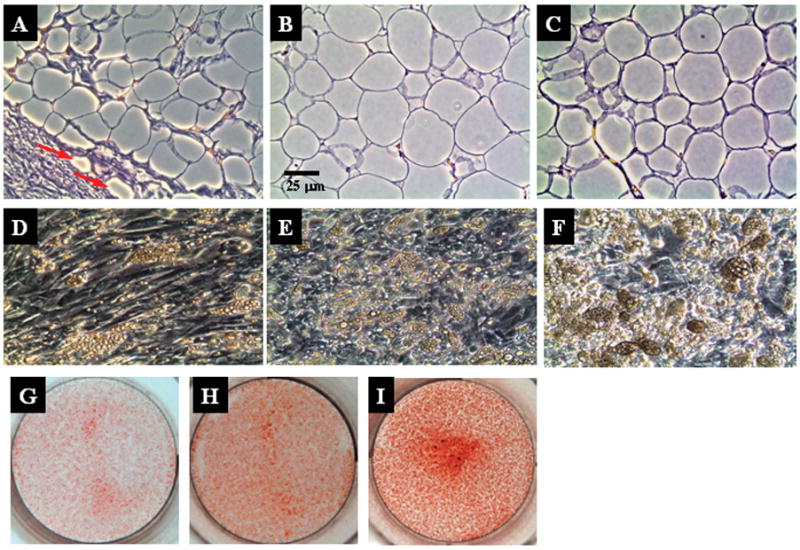
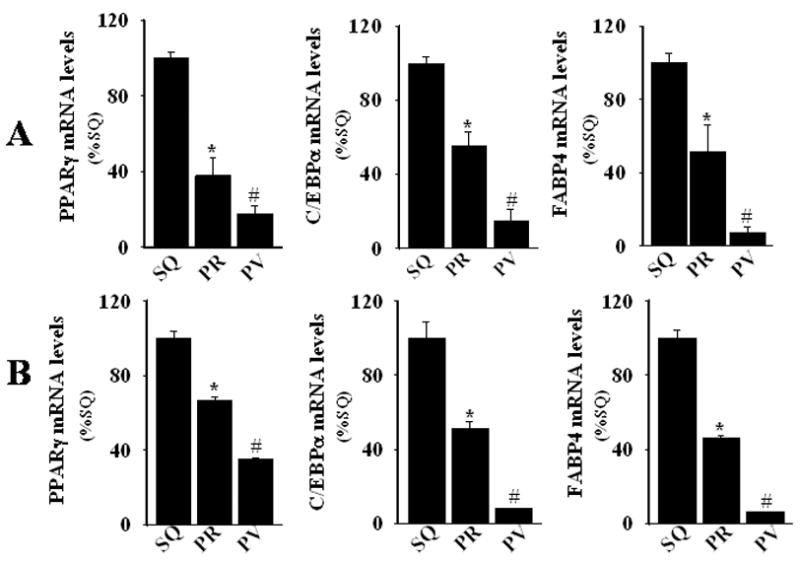
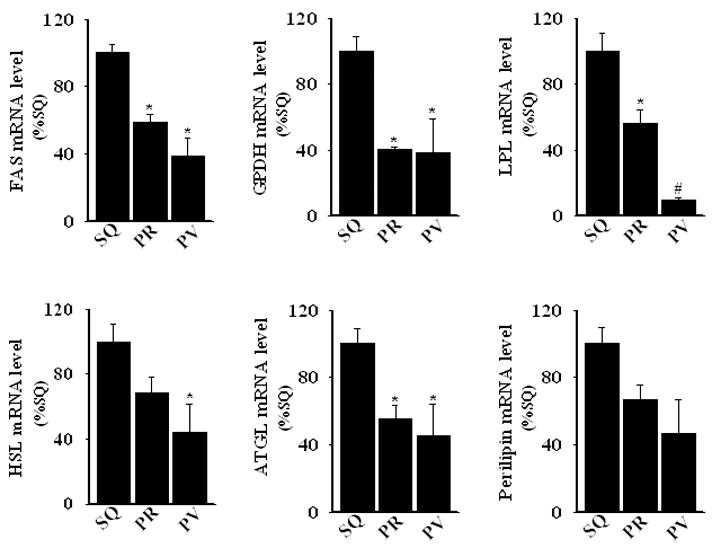
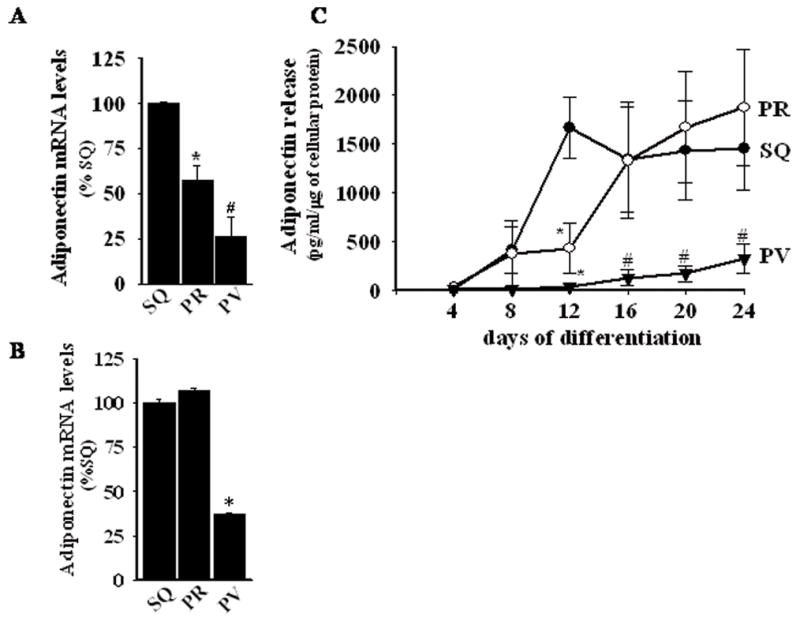
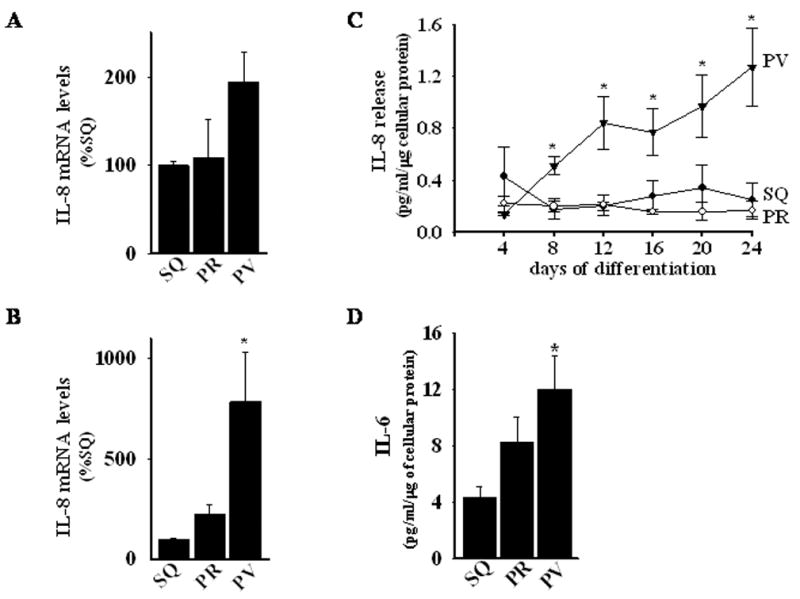
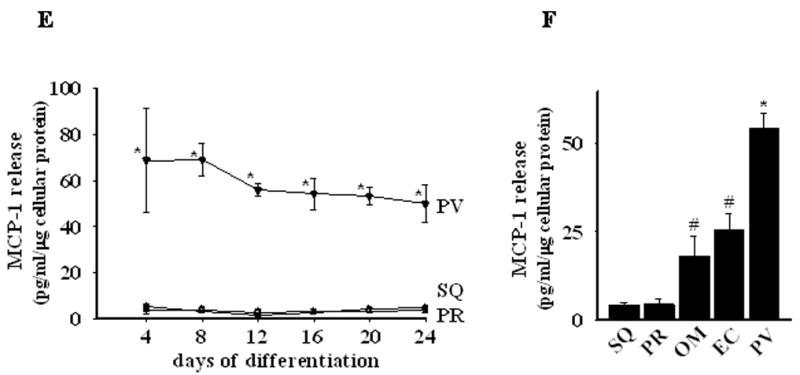
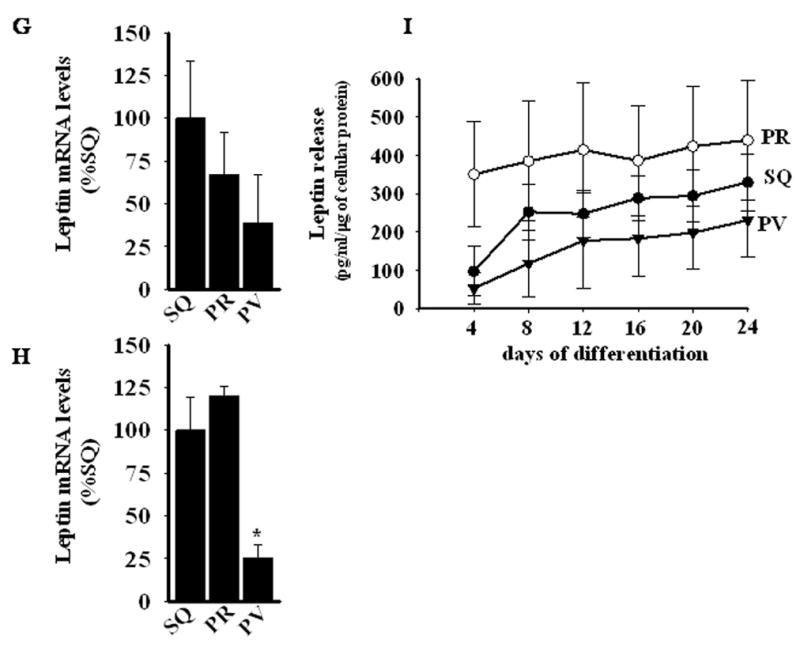
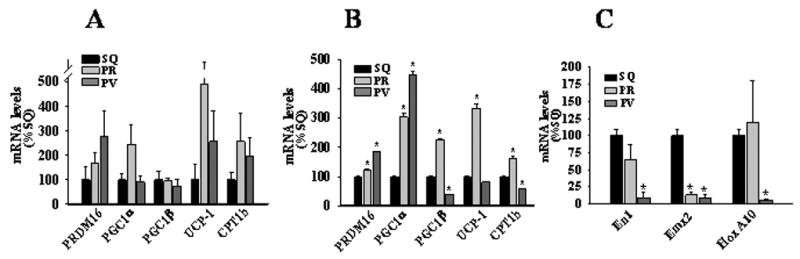
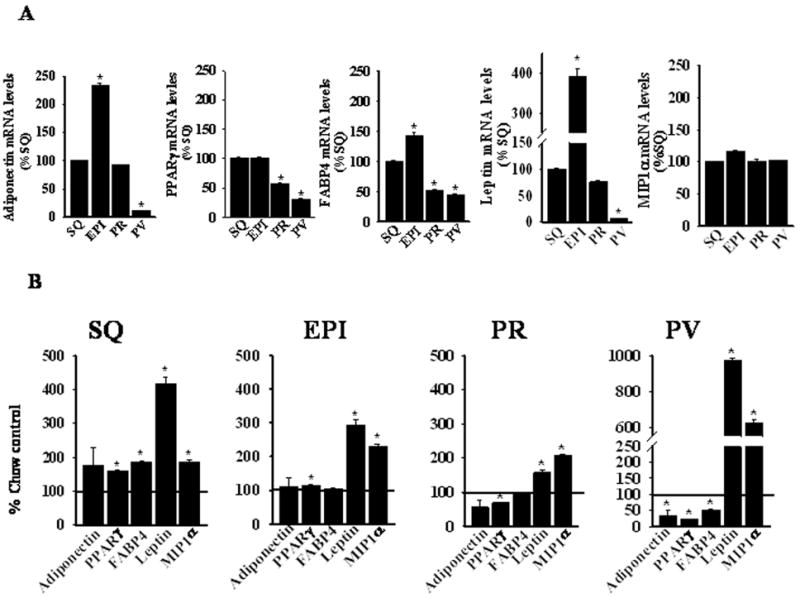
Adipose tissue depots originate from distinct precursor cells, are functionally diverse, and modulate disease processes in a depot-specific manner. However, the functional properties of perivascular adipocytes, and their influence on disease of the blood vessel wall, remain to be determined. We show that human coronary perivascular adipocytes exhibit a reduced state of adipocytic differentiation as compared with adipocytes derived from subcutaneous and visceral (perirenal) adipose depots. Secretion of antiinflammatory adiponectin is markedly reduced, whereas that of proinflammatory cytokines interleukin-6, interleukin-8, and monocyte chemoattractant protein-1, is markedly increased in perivascular adipocytes. These depot-specific differences in adipocyte function are demonstrable in both freshly isolated adipose tissues and in vitro-differentiated adipocytes. Murine aortic arch perivascular adipose tissues likewise express lower levels of adipocyte-associated genes as compared with subcutaneous and visceral adipose tissues. Moreover, 2 weeks of high-fat feeding caused further reductions in adipocyte-associated gene expression, while upregulating proinflammatory gene expression, in perivascular adipose tissues. These changes were observed in the absence of macrophage recruitment to the perivascular adipose depot. We conclude that perivascular adipocytes exhibit reduced differentiation and a heightened proinflammatory state, properties that are intrinsic to the adipocytes residing in this depot. Dysfunction of perivascular adipose tissue induced by fat feeding suggests that this unique adipose depot is capable of linking metabolic signals to inflammation in the blood vessel wall.


Figures

Figure 1
Figure 1
Top panel, Light microscopic appearance of human perivascular (A), perirenal (B), and subcutaneous (C) adipose tissues in situ. Tissues were harvested from the same patient, stained with hematoxylin and eosin, sectioned and photographed (X 20 magnification). Red arrows indicate adventitial infiltration of adipocytes. Middle panel, Lipid droplet accumulation within in vitro differentiated adipocytes from perivascular (D), perirenal (E), and subcutaneous (F) adipose depots. Preadipocytes were isolated from each depot and differentiated for 28 days as described in Methods. Cells were fixed and imaged using phase contrast microscopy (X 20 magnification). Bottom panel, Images of oil red O stained, perivascular (G), perirenal (H), and subcutaneous (I) differentiated adipocytes in vitro.
Figure 2
Figure 2
Real-time PCR determination of mRNA levels of PPARγ, C/EBPα, and FABP4 in (A) human subcutaneous (SQ), perirenal (PR), and perivascular (PV) adipose tissues and in (B) 28-day in vitro differentiated adipocytes from these depots. RNA was subjected to quantitative PCR, normalized, and expressed relative to levels observed in corresponding subcutaneous adipose tissues or cells. Values represent the mean ± SEM of three different donors. *, p < 0.05 versus SQ; #, p < 0.05 versus SQ and PR.
Figure 3
Figure 3
Real-time PCR determination of mRNA levels of FAS, GPDH, LPL, HSL, ATGL, and perilipin in human SQ, PR, and PV 28-day in vitro differentiated adipocytes. Methods are as described for Figure 3; results represent the mean ± SEM of 3–4 different donors. *, p < 0.05 versus SQ; #, p < 0.05 versus SQ and PR.
Figure 4
Figure 4
Panels A and B, Real-time PCR determination of mRNA levels of adiponectin in (A) adipose tissues and in (B) in vitro differentiated adipocytes from human SQ, PR, and PV adipose depots. Methods are as described for Figure 3. Panel C, Adiponectin release by in vitro differentiating adipocytes as a function of time in differentiation medium (ELISA). Values represent the mean ± SEM of 3–4 different donors. *, p < 0.05 versus SQ; #, p < 0.05 versus SQ and PR for panels A–C.
Figure 5
Figure 5
Panels A and B, Real-time PCR determination of mRNA levels of IL-8 in (A) adipose tissues and in (B) in vitro differentiated adipocytes from human SQ, PR, and PV adipose depots. *, p< 0.05 versus SQ and PR. Panel C, IL-8 release by in vitro differentiating adipocytes as a function of time in differentiation medium (ELISA). *, p < 0.05 versus SQ and PR. Panel D, IL-6 release by 24-day in vitro differentiated adipocytes from SQ, PR, and PV adipose tissues. *, p < 0.05 versus SQ. Panel E, MCP-1 release by in vitro differentiating adipocytes as a function of time in differentiation medium (ELISA). *, p < 0.05 versus SQ and PR. Panel F, Comparison of MCP-1 release by 24-day in vitro differentiated adipocytes from SQ, PR, omental (OM), epicardial (EC), and PV adipose tissues. (p values) Panel G and H, Real-time PCR determination of mRNA levels of leptin in (A) adipose tissue and in (B) in vitro differentiated adipocytes from human SQ, PR, and PV adipose depots. *, p < 0.05 versus SQ and PR. All values are expressed as mean ± SEM of 3–5 different donors and are expressed relative to levels observed in SQ adipose tissues or cells.
Figure 5
Figure 5
Panels A and B, Real-time PCR determination of mRNA levels of IL-8 in (A) adipose tissues and in (B) in vitro differentiated adipocytes from human SQ, PR, and PV adipose depots. *, p< 0.05 versus SQ and PR. Panel C, IL-8 release by in vitro differentiating adipocytes as a function of time in differentiation medium (ELISA). *, p < 0.05 versus SQ and PR. Panel D, IL-6 release by 24-day in vitro differentiated adipocytes from SQ, PR, and PV adipose tissues. *, p < 0.05 versus SQ. Panel E, MCP-1 release by in vitro differentiating adipocytes as a function of time in differentiation medium (ELISA). *, p < 0.05 versus SQ and PR. Panel F, Comparison of MCP-1 release by 24-day in vitro differentiated adipocytes from SQ, PR, omental (OM), epicardial (EC), and PV adipose tissues. (p values) Panel G and H, Real-time PCR determination of mRNA levels of leptin in (A) adipose tissue and in (B) in vitro differentiated adipocytes from human SQ, PR, and PV adipose depots. *, p < 0.05 versus SQ and PR. All values are expressed as mean ± SEM of 3–5 different donors and are expressed relative to levels observed in SQ adipose tissues or cells.
Figure 6
Figure 6
Panel A and B, Real-time PCR determination of PRDM16, PGC1α/β, UCP-1, and CPT1b mRNA expression in human adipose tissues (A) and in vitro differentiated adipocytes (B). Panel C, Real-time PCR determination of En1, Emx2, and HoxA10 mRNA expression in in vitro differentiated subcutaneous, perirenal, and perivascular adipocytes. Values represent mean ± SEM from 3–4 different donors. *, p < 0.05 compared to SQ.
Figure 7
Figure 7
Real-time PCR determination of adiponectin, PPARγ, FABP4, leptin, and MIP1α mRNA expression in SQ, epididymal (EPI), PR, and PV adipose tissues of C57BL/6 mice fed (A) a chow or (B) a high fat diet for two weeks. mRNA levels in panel A are expressed relative to subcutaneous adipose tissue data, while in panel B, levels are expressed relative to the corresponding depot in chow-fed mice. Values represent the mean ± SEM of 3–5 mice per group. *, p < 0.05 versus SQ data (Panel A) or versus corresponding chow-fed data (Panel B).

Comment in

References

    1. Lusis AJ. Atherosclerosis. Nature. 2000;407:233–241. - PMC - PubMed
    1. Ross R. The pathogenesis of atherosclerosis: a prospective for the 1990s. Nature. 1993;362:801–809. - PubMed
    1. Ross R. Atherosclerosis-an inflammatory disease. N Engl J Med. 1999;340:115–126. - PubMed
    1. Tedgui A, Mallat Z. Cytokines in atherosclerosis: pathogenic and regulatory pathways. Physiol Rev. 2006;86:515–581. - PubMed
    1. Doran AC, Meller N, McNamara CA. Role of smooth muscle cells in the initiation and early progression of atherosclerosis. Arterioscler Thromb Vasc Biol. 2008;28:812–819. - PMC - PubMed

Publication types

MeSH terms