

Calprotectin S100A9 calcium-binding loops I and II are essential for keratinocyte resistance to bacterial invasion
- PMID: 19122197
- PMCID: PMC2652321
- DOI: 10.1074/jbc.M806605200
Calprotectin S100A9 calcium-binding loops I and II are essential for keratinocyte resistance to bacterial invasion
Abstract
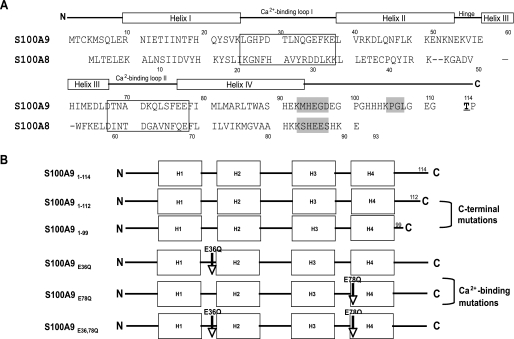
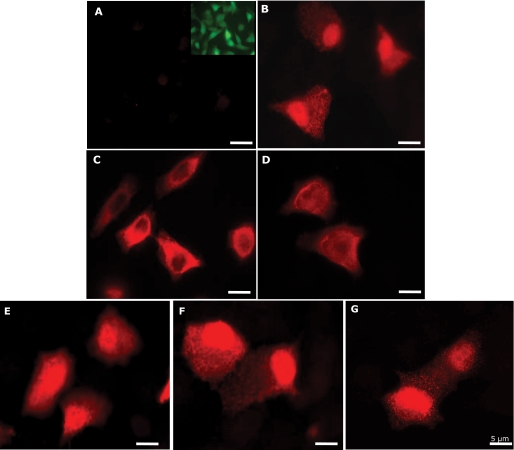
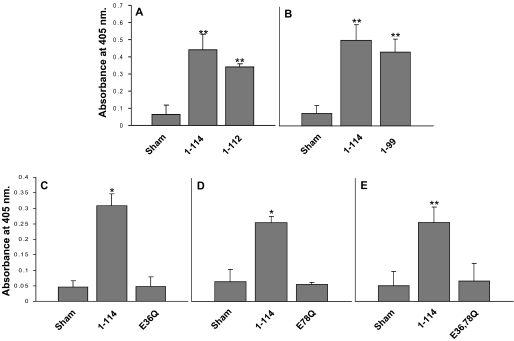
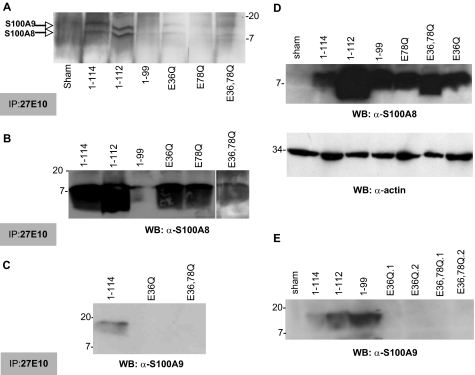
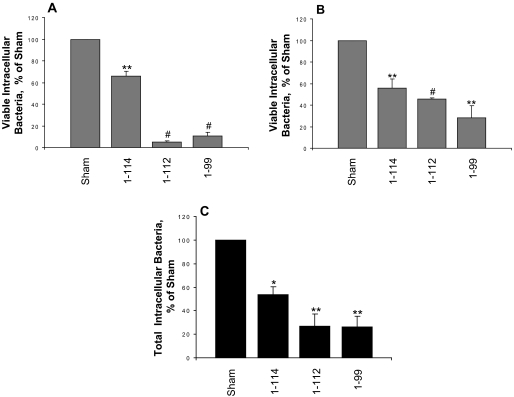
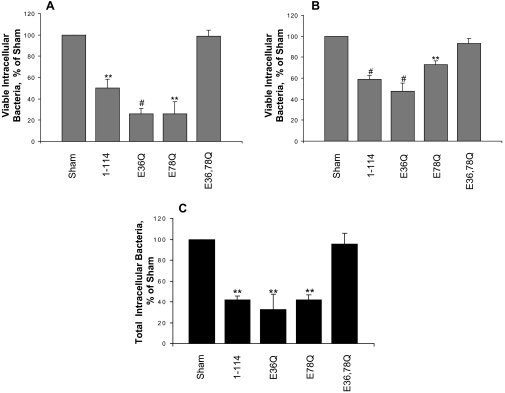
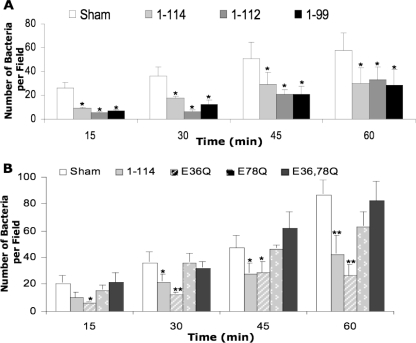
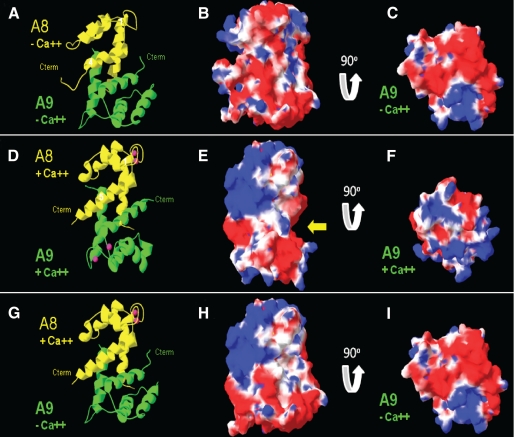
Epithelial cells expressing calprotectin, a heterodimer of S100A8 and S100A9 proteins, are more resistant to bacterial invasion. To determine structural motifs that affect resistance to bacterial invasion, mutations were constructed in S100A9 targeting the calcium-binding loops I and II (E36Q, E78Q, E36Q,E78Q) and the C terminus (S100A9(1-99) and S100A9(1-112)), which contains putative antimicrobial zinc-binding and phosphorylation sites. The S100A8 and mutated S100A9 encoding plasmids were transfected into calprotectin-negative KB carcinoma cells. All transfected cells (except KB-sham) expressed 27E10-reactive heterodimers. In bacterial invasion assays with Listeria monocytogenes and Salmonella enterica serovar Typhimurium (Salmonella typhimurium), cell lines expressing S100A8 in complex with S100A9E36Q, S100A9E78Q, S100A9(1-99), or S100A9(1-112) mutants or the S100A9(1-114) (full-length) calprotectin resisted bacterial invasion better than KB-sham. When compared with KB-S100A8/A9(1-114), cells expressing truncated S100A9(1-99) or S100A9(1-112) with S100A8 also showed increased resistance to bacterial invasion. In contrast, glutamic acid residues 36 and 78 in calcium-binding loops I and II promote resistance in epithelial cells, because cells expressing S100A9E36Q,E78Q with S100A8 were unable to resist bacterial invasion. Mutations in S100A9 E36Q, E78Q were predicted to cause loss of the calcium-induced positive face in calprotectin, reducing interactions with microtubules and appearing to be crucial for keratinocyte resistance to bacterial invasion.
Figures
Similar articles
-
IL-1 receptor regulates S100A8/A9-dependent keratinocyte resistance to bacterial invasion.Mucosal Immunol. 2012 Jan;5(1):66-75. doi: 10.1038/mi.2011.48. Epub 2011 Oct 26. Mucosal Immunol. 2012. PMID: 22031183 Free PMC article.
-
The antimicrobial heterodimer S100A8/S100A9 (calprotectin) is upregulated by bacterial flagellin in human epidermal keratinocytes.J Invest Dermatol. 2010 Oct;130(10):2423-30. doi: 10.1038/jid.2010.158. Epub 2010 Jun 17. J Invest Dermatol. 2010. PMID: 20555353
-
Calcium-dependent tetramer formation of S100A8 and S100A9 is essential for biological activity.J Mol Biol. 2006 Jun 16;359(4):961-72. doi: 10.1016/j.jmb.2006.04.009. Epub 2006 Apr 21. J Mol Biol. 2006. PMID: 16690079
-
Calprotectin and the Initiation and Progression of Head and Neck Cancer.J Dent Res. 2018 Jun;97(6):674-682. doi: 10.1177/0022034518756330. Epub 2018 Feb 14. J Dent Res. 2018. PMID: 29443623 Free PMC article. Review.
-
S100A8 and S100A9 in inflammation and cancer.Biochem Pharmacol. 2006 Nov 30;72(11):1622-31. doi: 10.1016/j.bcp.2006.05.017. Epub 2006 Jul 17. Biochem Pharmacol. 2006. PMID: 16846592 Review.
Cited by
-
Changes in gene expression in human meibomian gland dysfunction.Invest Ophthalmol Vis Sci. 2011 Apr 25;52(5):2727-40. doi: 10.1167/iovs.10-6482. Print 2011 Apr. Invest Ophthalmol Vis Sci. 2011. PMID: 21372006 Free PMC article.
-
The oral microbiome and the immunobiology of periodontal disease and caries.Immunol Lett. 2014 Dec;162(2 Pt A):22-38. doi: 10.1016/j.imlet.2014.08.017. Epub 2014 Nov 8. Immunol Lett. 2014. PMID: 25447398 Free PMC article. Review.
-
Influence of energy balance on the antimicrobial peptides S100A8 and S100A9 in the endometrium of the post-partum dairy cow.Reproduction. 2013 Apr 29;145(5):527-39. doi: 10.1530/REP-12-0513. Print 2013 May. Reproduction. 2013. PMID: 23533291 Free PMC article.
-
Antimicrobial peptides: Defending the mucosal epithelial barrier.Front Oral Health. 2022 Aug 1;3:958480. doi: 10.3389/froh.2022.958480. eCollection 2022. Front Oral Health. 2022. PMID: 35979535 Free PMC article. Review.
-
Autonomous immunity in mucosal epithelial cells: fortifying the barrier against infection.Microbes Infect. 2016 Jun;18(6):387-398. doi: 10.1016/j.micinf.2016.03.008. Epub 2016 Mar 19. Microbes Infect. 2016. PMID: 27005450 Free PMC article. Review.
References
-
- Rudney, J. D., and Chen, R. (2006) Arch. Oral. Biol. 51 291-298 - PubMed
-
- Striz, I., and Trebichavsky, I. (2004) Physiol. Res. 53 245-253 - PubMed
-
- Korndorfer, I. P., Brueckner, F., and Skerra, A. (2007) J. Mol. Biol. 370 887-898 - PubMed
-
- Kligman, D., and Hilt, D. C. (1988) Trends Biochem. Sci. 13 437-443 - PubMed
Publication types
MeSH terms
Substances
Grants and funding
LinkOut - more resources
Full Text Sources
Other Literature Sources
Medical
Molecular Biology Databases
Miscellaneous
