. 2009 Jan;27(1):66-75.
doi: 10.1038/nbt.1518. Epub 2009 Jan 4.

PeakSeq enables systematic scoring of ChIP-seq experiments relative to controls

Affiliations

PeakSeq enables systematic scoring of ChIP-seq experiments relative to controls

Joel Rozowsky et al. Nat Biotechnol. 2009 Jan.

Abstract

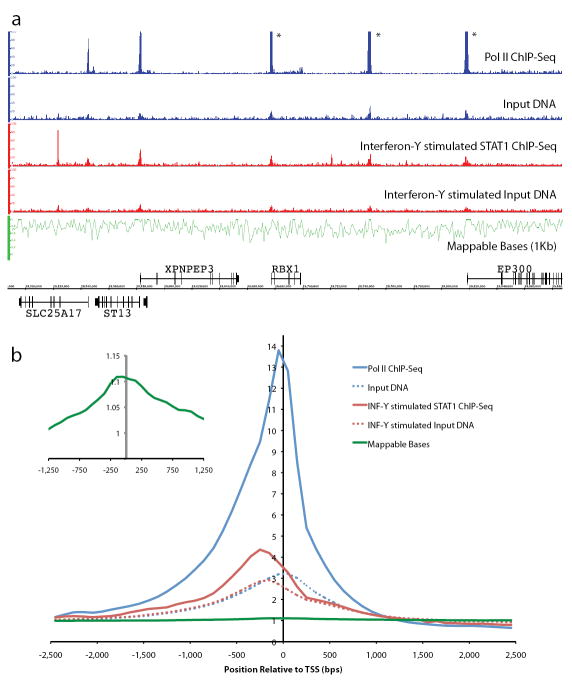
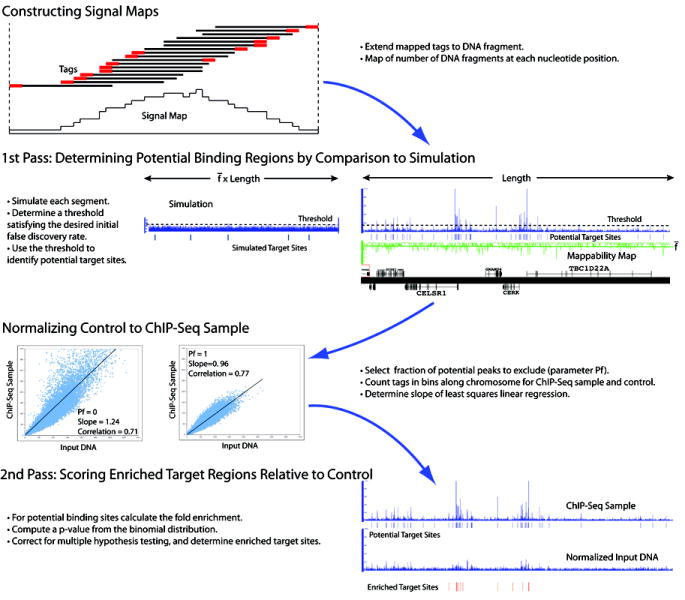
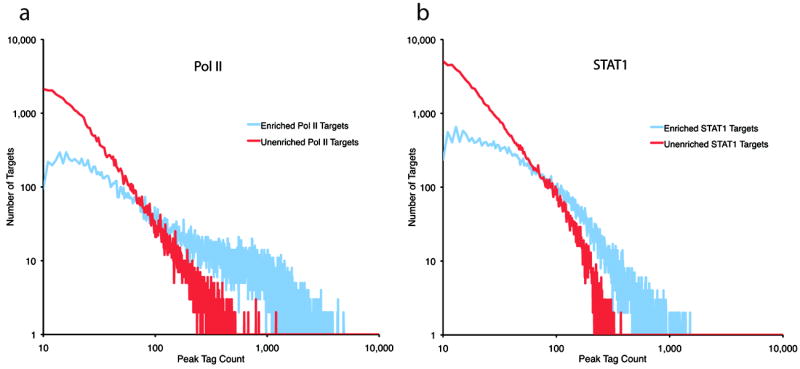
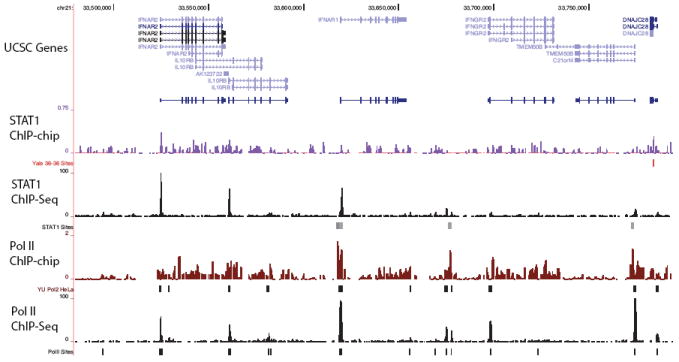
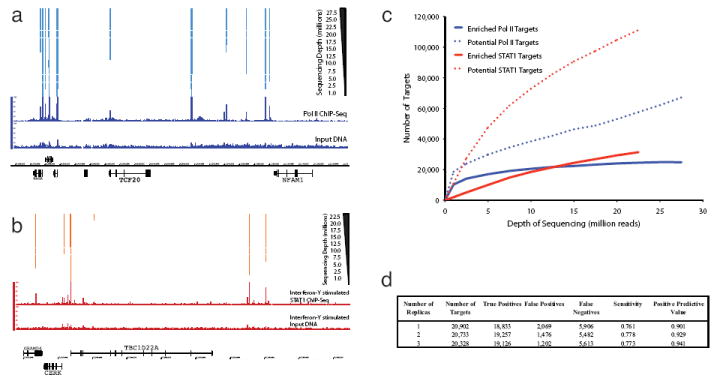
Chromatin immunoprecipitation (ChIP) followed by tag sequencing (ChIP-seq) using high-throughput next-generation instrumentation is fast, replacing chromatin immunoprecipitation followed by genome tiling array analysis (ChIP-chip) as the preferred approach for mapping of sites of transcription-factor binding and chromatin modification. Using two deeply sequenced data sets for human RNA polymerase II and STAT1, each with matching input-DNA controls, we describe a general scoring approach to address unique challenges in ChIP-seq data analysis. Our approach is based on the observation that sites of potential binding are strongly correlated with signal peaks in the control, likely revealing features of open chromatin. We develop a two-pass strategy called PeakSeq to compensate for this. A two-pass strategy compensates for signal caused by open chromatin, as revealed by inclusion of the controls. The first pass identifies putative binding sites and compensates for genomic variation in the 'mappability' of sequences. The second pass filters out sites not significantly enriched compared to the normalized control, computing precise enrichments and significances. Our scoring procedure enables us to optimize experimental design by estimating the depth of sequencing required for a desired level of coverage and demonstrating that more than two replicates provides only a marginal gain in information.


Figures

Figure 1
Figure 1. ChIP-Seq Characteristics
1a) The first and third signal tracks are plots of mapped fragment density for Pol II (in blue) and STAT1 (in red), respectively. The second and fourth tracks correspond to the input DNA tracks for unstimulated (in blue) and interferon-γ stimulated HeLa S3 cells (in red). The vertical axis for the first four tracks is the count of the number of overlapping DNA fragments at each nucleotide position (peaks in the top track indicated with a star have been truncated). The fifth track shows the fraction of uniquely mappable bases plotted in 1 kb bins (in green). We observe that many of the peaks in the Pol II and STAT1 tracks match corresponding peaks in the input DNA controls, only some of which are enriched in their height relative to the control. 1b) Here we see the signal for Pol II (solid blue line), STAT1 (solid red line) ChIP-Seq and corresponding unstimulated (dashed blue line) and interferon-γ stimulated (dashed red line) input DNA controls aggregated over regions proximal to all human CCDS transcription start sites (± 2.5 Kb) plotted in 100 bp bins. We observe significant enrichment for both transcription factors as well as the input DNA controls over TSSs. The aggregated signal for the fraction of mappable bases is also plotted (green line) and we also observe a smaller but significant enhancement over TSSs (see insert where the vertical scale is from 0.95 to 1.15), though not as pronounced as the sequencing results.
Figure 2
Figure 2. PeakSeq Scoring Schematic
We present a schematic of the scoring procedure. 1) Mapped reads are extended to have the average DNA fragment length (reads on either strand are extended in the 3’ direction relative to that strand) and then accumulated to form a fragment density signal map. 2) In the first pass of the PeakSeq scoring procedure potential binding sites are determined. The threshold is determined by comparison of putative peaks with a simulated segment with the same number of mapped reads. The length of the simulated segment is scaled by the fraction of uniquely mappable starting bases. 3) After selecting the fraction of potential targets sites that should be excluded from the normalization, Pf, a scaling factor is determined by linear regression of the ChIP-Seq sample against the input DNA control in 10 Kb bins. Bins that overlap the potential targets regions selected for exclusion are not used for regression. The fitted slopes as well as the Pearson correlations are displayed for Pf set to either 0 or 1. 4) Enrichment and significance are computed for putative binding regions.
Figure 3
Figure 3. ChIP-Seq Target List Scaling
On a log-log plot we show the distribution of target regions that are enriched (blue) relative to input DNA and those that are not (red). The horizontal axis is the count of the sequence tags that are within a target peak while the vertical axis the number of target regions with that count. The left and right panel shows the results for Pol II and STAT1, respectively.
Figure 4
Figure 4. ChIP-Seq vs ChIP-chip
In this figure we show the signal tracks and target binding sites for Pol II and STAT1 for both ChIP-chip and ChIP-Seq. The ChIP-chip data was generated as part of the pilot-phase of the ENCODE project for one percent of the human genome. The region displayed is the cytokine receptor locus on chromosome 21. We observe that the ChIP-Seq signal has better signal to noise and is higher resolution than the corresponding ChIP-chip data. Data was obtained from the UCSC Genome Browser.
Figure 5
Figure 5. Depth of Sequencing and Value of Replicas
5a) Fragment density signal tracks are plotted for Pol II and the input DNA control as well as the target regions that are identified (significantly enriched) as a function of the number of mapped sequence reads. The same numbers of sequence reads are used for both sample and control. More prominent peaks are identified with fewer reads, while weaker peaks require greater depth. 5b) Similar plot with STAT1 and matching interferon-γ stimulated HeLa input DNA control. 5c) Here we plot as a function of the number of mapped sequence reads the number of putative Pol II (blue line) and STAT1 (red line) targets identified and the fraction for each of these that are enriched relative to input DNA. We see that while the number of putative targets continues to climbs for both Pol II and STAT1 the number of enriched targets begins to plateau. The number of Pol II targets appears to be saturating faster than STAT1. 5d) We summarize the results of analyzing 9 million mapped Pol II ChIP-Seq sequence reads using 1, 2 or 3 biological replicas. We calculate sensitivity and positive predictive values using the targets identified with all the available sequence reads (~29 million uniquely mapped reads) as gold standard positives and the remainder as negatives. Only a marginal gain in positive predictive value at the cost of sensitivity is gained by using 3 biological replicas instead of 2 biological replicas.

References

    1. Ren B, et al. Genome-Wide Location and Function of DNA Binding Proteins. Science. 2000;290:2306–2309. - PubMed
    1. Iyer VR, et al. Genomic binding sites of the yeast cell-cycle transcription factors SBF and MBF. Nature. 2001;409:533–8. - PubMed
    1. Horak CE, Snyder M. ChIP-chip: a genomic approach for identifying transcription factor binding sites. Methods Enzymol. 2002;350:469–83. - PubMed
    1. Kim J, et al. Mapping DNA-protein interactions in large genomes by sequence tag analysis of genomic enrichment. Nat Methods. 2005;2:47–53. - PubMed
    1. Wei C, et al. A global map of p53 transcription-factor binding sites in the human genome. Cell. 2006;124:207–19. - PubMed

Publication types

Associated data