

doi: 10.1038/nn.2240.
Epub 2009 Jan 4.
Collagen VI protects neurons against Abeta toxicity
Affiliations
- PMID: 19122666
- PMCID: PMC2812922
- DOI: 10.1038/nn.2240
Item in Clipboard
Collagen VI protects neurons against Abeta toxicity
Nat Neurosci.
2009 Feb.
Abstract
Amyloid-beta (Abeta) peptides, widely presumed to cause Alzheimer's disease, increased mouse neuronal expression of collagen VI through a mechanism involving transforming growth factor signaling. Reduction of collagen VI augmented Abeta neurotoxicity, whereas treatment of neurons with soluble collagen VI blocked the association of Abeta oligomers with neurons, enhanced Abeta aggregation and prevented neurotoxicity. These results identify collagen VI as an important component of the neuronal injury response and demonstrate its neuroprotective potential.
Figures
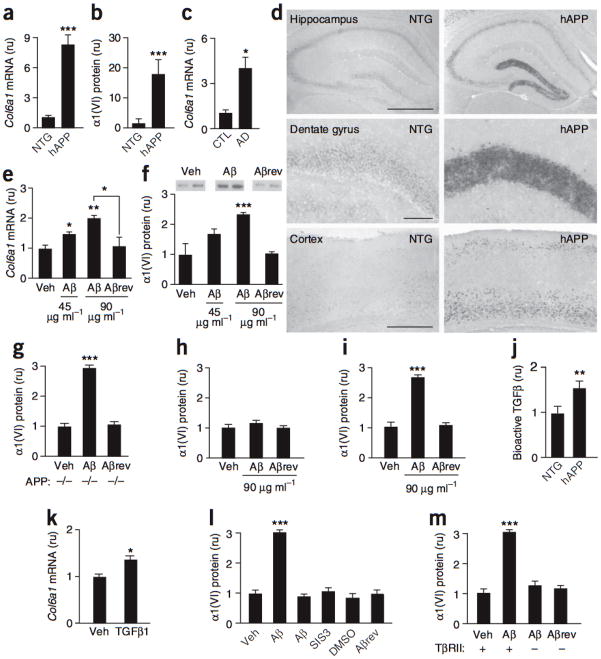
(a–c) Dentate gyrus Col6a1 mRNA (a) and α1(VI) protein (b) levels in nontransgenic (NTG) and hAPP-J20 mice (n= 11–13 per group, aged 3–6 months) and dentate gyrus Col6a1 mRNA levels (c) in nondemented humans (CTL, n = 3) and individuals with Alzheimer’s disease (AD, n = 8) (Supplementary Methods and Supplementary Fig. 3 online). The mean Col6a1/Gapdh mRNA, α1(VI)/tubulin and Col6a1/NSE mRNA ratios in nontransgenic or CTL samples (a–c) were defined as 1. (d) In situ hybridization of coronal mouse brain sections with a Col6a1-specific antisense riboprobe. Scale bars represent 500 μm. (e,f) Primary cultures of purified neocortical/hippocampal neurons of nontransgenic mice treated for 24 h with vehicle (Veh), Aβ or Aβrev (45 or 90 μg ml−1). Col6a1 mRNA levels in cell lysates (e) and α1(VI) protein levels in medium (f, representative western blot signals above). The average Col6a1/Gapdh mRNA and α1(VI)/tubulin protein ratios in vehicle-treated cultures were defined as 1. (g) α1(VI) protein levels in medium of neuronal cultures from APP-deficient mice treated for 24 h with vehicle, Aβ42 (90 μg ml−1) or Aβrev (90 μg ml−1). (h,i) α1(VI) protein levels in medium of nontransgenic cultures of mouse astrocytes (h) or neurons and astrocytes (i) treated with vehicle, Aβ42 or Aβrev for 24 h. (j) Hippocampal levels of bioactive TGFβ in 6–7-month-old nontransgenic (n = 7) and hAPP-J20 (n = 5) mice, measured by bioassay. (k) Col6a1 mRNA levels in nontransgenic neuronal cultures treated with vehicle or bioactive TGFβ1 (10 nM) for 24 h. (l) Nontransgenic neuronal cultures treated with culture medium (Veh), dimethyl sulfoxide (DMSO, 0.2% final concentration, vol/vol) or Aβ peptides (90 μg ml−1). Cultures were treated with a Smad3 inhibitor (SIS3) 1 h before and throughout the 24 h exposure to Aβ and α1(VI) levels were measured in the medium. (m) Purified neuronal cultures from TβRII wild-type (+) mice or knockout mice (–) lacking TβRII expression in forebrain neurons were treated with vehicle or Aβ peptides (90 μg ml−1), and α1(VI) levels were measured in the medium. For all cell culture studies, n = 4–8 wells per condition from 2–3 independent experiments. *P < 0.05, **P < 0.01 and ***P < 0.001 versus leftmost bar or as indicated by bracket (Tukey test). Error bars represent s.e.m.

(a) Primary cultures of purified neocortical/hippocampal neurons from mice with various Col6a1 genotypes treated with Aβ42 or Aβrev (90 μg ml−1) for 24 h. Neurotoxicity was determined by trypan blue staining. (b) Ex situ atomic force microscopy images of fibrillar (pH 7–8) and denatured (pH 2–3) collagen VI. Scale bar represents 200 nm. (c–e) Beginning 1 h before and lasting throughout exposure to Aβ (45 μg ml−1), wild-type neuronal cultures were treated with vehicle, human collagen VI at pH 7–8 (0–100 μg ml−1, c) or pH 2–3 (20 μg ml−1, d), or human collagen I at pH 7–8 (20 μg ml−1, e). n = 4–8 wells/condition in 1–2 independent experiments. (f) Wild-type neuronal cultures were pretreated with vehicle or collagen VI (pH 7–8) and exposed to Aβ42 (45 μg ml−1). After 1 h, the cell association of Aβ42 oligomers was assessed by immunostaining (6E10 antibody). Neuronal nuclei were stained (DAPI, blue). In vehicle-treated cultures, most Aβ was cell associated. In collagen VI–treated cultures, most Aβ was sequestered in large extracellular aggregates. Scale bar represents 10 μm. (g) Mature wild-type neurons (4 weeks) pretreated with vehicle, collagen VI (pH 7–8) or collagen I (pH 7–8) were exposed to Aβ42 (45 μg ml−1) and immunostained for Aβ (red) and microtubule-associated protein 2 (MAP-2, green). Scale bar represents 20 μm. (h) Immature neurons were treated with collagen VI and Aβ42 (as in f and g) and double labeled for Aβ (red) and collagen VI (green). Scale bar represents 20 μm. We observed similar immunostaining patterns in three independent experiments per condition. (i) Aggregation of monomeric Aβ42 was monitored by in situ AFM for 3 h. Images show the aggregation state 145 min after incubation of Aβ42 in the absence (top) or presence (bottom) of collagen VI (pH 7–8). Scale bar represents 2 μm. (j,k) Large Aβ aggregates (greater than or equal to40 times 103 nm2, representing >95th percentile in size of all Aβ aggregates, j) and small Aβ aggregates (less than or equal to 4 times 103 nm2, estimated to consist of <40 Aβ peptides, k) visualized by AFM were quantified at 145 min (n = 4 images per condition). AFM results were repeated in two independent experiments. *P < 0.05, **P < 0.01 and ***P < 0.001 versus leftmost bar or as indicated by bracket (Tukey test or Fisher’s exact test). Error bars represent s.e.m.
References
Publication types
MeSH terms
Substances
Grants and funding
LinkOut - more resources
Full Text Sources
Other Literature Sources
Medical
Molecular Biology Databases
