. 2009 Feb;6(2):161-6.
doi: 10.1038/nmeth.1288. Epub 2009 Jan 4.

A genetically encoded fluorescent reporter of ATP:ADP ratio

Affiliations

A genetically encoded fluorescent reporter of ATP:ADP ratio

Jim Berg et al. Nat Methods. 2009 Feb.

Abstract

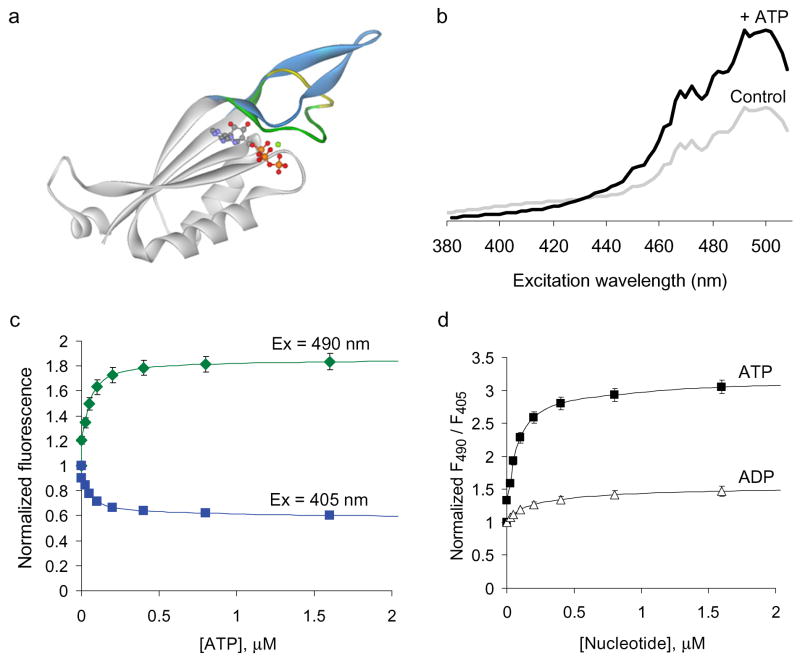
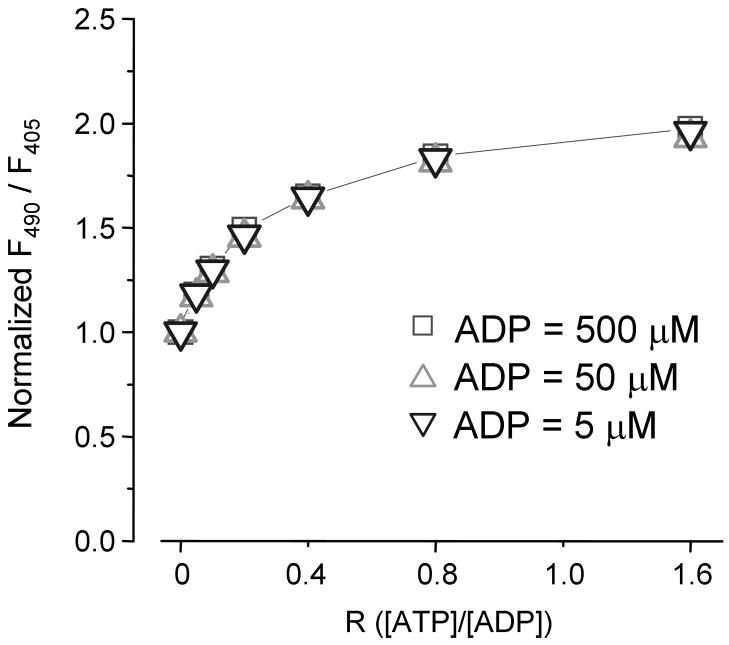
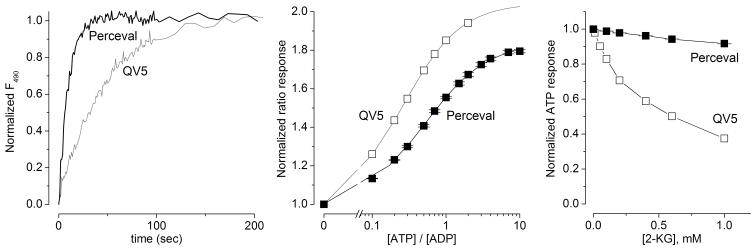
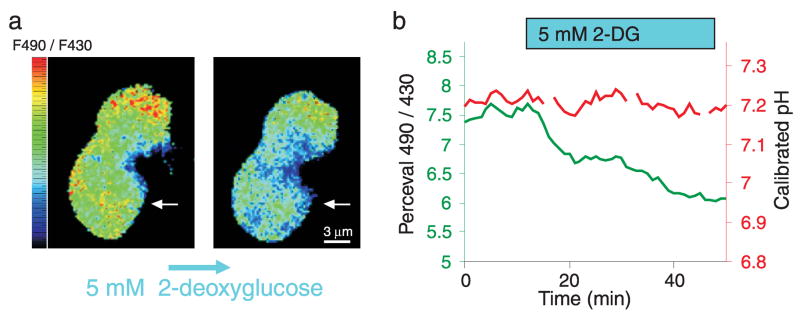
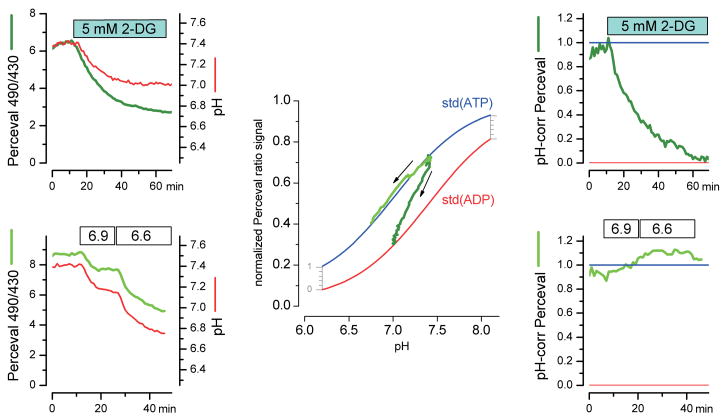
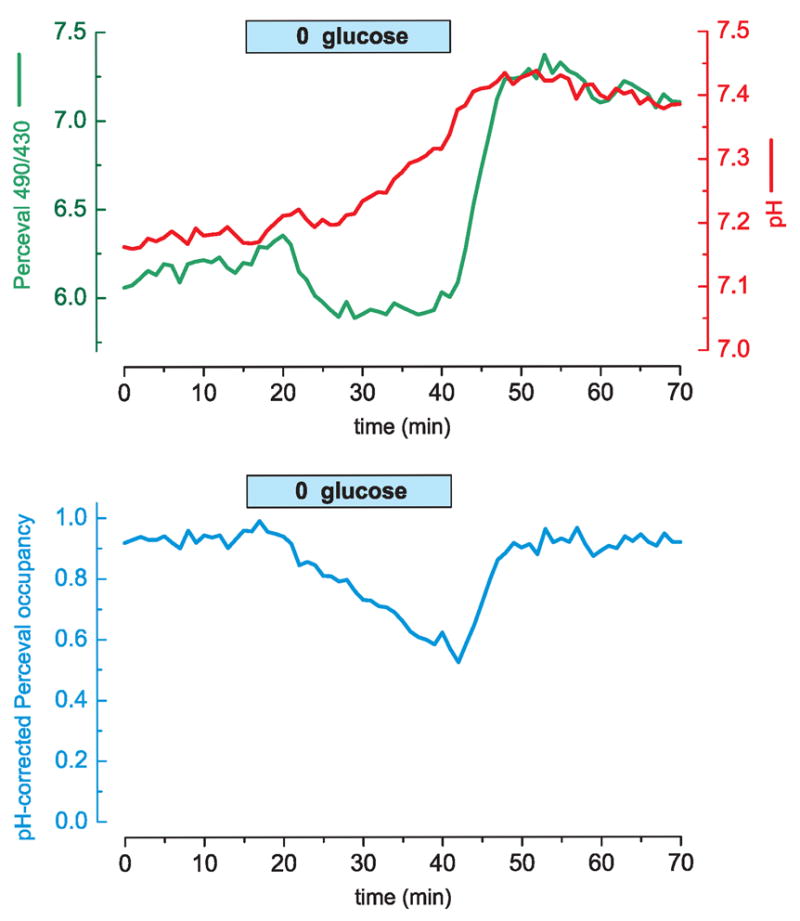
We constructed a fluorescent sensor of adenylate nucleotides by combining a circularly permuted variant of GFP with a bacterial regulatory protein, GlnK1, from Methanococcus jannaschii. The sensor's affinity for Mg-ATP was <100 nM, as seen for other members of the bacterial PII regulator family, a surprisingly high affinity given that normal intracellular ATP concentration is in the millimolar range. ADP bound the same site of the sensor as Mg-ATP, competing with it, but produced a smaller change in fluorescence. At physiological ATP and ADP concentrations, the binding site is saturated, but competition between the two substrates causes the sensor to behave as a nearly ideal reporter of the ATP:ADP concentration ratio. This principle for sensing the ratio of two analytes by competition at a high-affinity site probably underlies the normal functioning of PII regulatory proteins. The engineered sensor, Perceval, can be used to monitor the ATP:ADP ratio during live-cell imaging.


Figures

Figure 1
Figure 1. Properties of the GlnK1-cpmVenus (QV5) construct
(a) Ribbon representation of one subunit of the GlnK1 protein without a ligand (grey/blue), or with Mg2+-ATP (grey/green/yellow, with the ligand in ball-and-stick form). The T-loop (colored) becomes compact and ordered in the presence of Mg2+-ATP. The blue structure is just one of the many alternative and disordered structures seen for the unliganded T-loop. The yellow region indicates the insertion points used for the circularly permuted fluorescent protein. Based on Protein Data Bank files 2j9e and 2j9d (ref. 13). (b) Excitation spectra of purified QV5 construct during control conditions (grey) and following addition of 50 μM Mg-ATP (black), emission at 530 nm. ATP addition leads to an increase in the 490 nm peak and a decrease in the 405 nm peak. (c) Fluorescence intensities when exciting at 490 nm (green) or 405 nm (blue), normalized by the initial value; emission at 530 nm. (d). The ratio of fluorescence intensities when exciting at 490 nm divided by 405 nm reveals a ~3-fold change upon ATP application (affinity = ~0.04 μM), but also a ~1.4-fold increase upon application of ADP (affinity = ~0.2 μM). Error bars indicate ± s.e.m. (n = 3).
Figure 2
Figure 2. The QV5 construct reports the ATP/ADP ratio
Application of ATP in the constant presence of three different concentrations of ADP demonstrates the increasing effective affinities of the sensor for ATP with increasing concentrations of ADP. The QV5 construct fluorescence response to ATP application in the presence of 5 μM, 50 μM, and 500 μM shows a half-maximal response at 1 μM, 10 μM, and 100 μM ATP respectively, corresponding to a half-maximal response when the ratio R equals ~0.2.
Figure 3
Figure 3. Perceval is an improved version of the QV5 construct
(a) Kinetics of fluorescence response to a half-maximal application of an ATP/ADP (from ADP alone) normalized to initial and final values. Perceval [0.4 mM ATP application in the presence of 0.1 mM ADP] responds with kinetics (τ ≈ 10 s) approximately 5-fold faster than the QV5 construct [0.2 mM ATP application in the presence of 0.1 mM ADP] (τ ≈ 50 s). (b) Perceval responds with a KR of ~0.5 while the QV5 construct has a KR of ~0.2. (c) Fluorescence response (495 nm/405 nm) to a saturating ATP concentration normalized to the level in the absence of 2-ketoglutarate (2KG). Perceval (half-maximal inhibition at 3 mM) is substantially less sensitive to 2KG than the QV5 construct (0.3 mM). Error bars (± s.e.m., n = 3) for Perceval data are smaller than the symbols.
Figure 4
Figure 4. Metabolic inhibition leads to a change in the Perceval signal
(a) A pixel-by-pixel ratio of the 490 nm excitation image by the 430 nm excitation image from two cultured HEK293 cells expressing Perceval during control conditions (left) and following 40 minutes of metabolic inhibition with 5 mM 2-deoxyglucose (2-DG). 2-DG application leads to a pronounced decrease in the ratio across the cell (Pseudocolored with scale of a minimum ratio of 5 (blue) and maximum of 9 (red)). (b) Plot of the 490 nm/430 nm ratio against time for the bottom cell (denoted with white arrow in a) shows a ~20% decrease in the ratio (green) following 2DG application. Concurrent measurement of intracellular pH of the same cell with the red pH indicator dye SNARF-5F shows no change in pH with metabolic inhibition.
Figure 5
Figure 5. Concurrent Perceval and pH monitoring, with pH correction of the Perceval signal
(a) Results from a cell with a 2-deoxyglucose challenge: dark green, Perceval fluorescence ratio (of excitation 490 nm over excitation 430 nm) and red, the pH signal from SNARF-5F, calibrated after the experiment (see Supplementary Methods). (b) Results from a cell with no metabolic challenge, where the pH of the bathing solution was changed to 6.9 and then to 6.6. (c) Plot of the normalized Perceval ratio versus pH (from a and b; see Supplementary Methods). The two standard curves are from cuvette assays of the ATP-loaded and ADP-loaded sensor at various pH. The initial signal was scaled to the cuvette data by assuming a starting ATP/ADP ratio of ~4. For each experiment (a in dark green and b in bright green), the arrow indicates the progression of time. Notice that the pure pH manipulation (from b) tracks along the pH dependence of the ATP-loaded sensor. (d, e) pH-corrected Perceval signals from the experiments shown in a and b. The correction is done for each data point by plotting the fractional occupancy at the actual pH, as indicated by the grey ruler in c.
Figure 6
Figure 6. Transient glucose removal leads to a reversible change in the ATP/ADP signal
(a) A cultured HEK293 cell expressing Perceval and loaded with the pH sensitive dye SNARF-5F displays an alkalinization when glucose is removed from the extracellular solution (10 mM glucose was replaced by equimolar sucrose). The Perceval signal shows a slight decrease upon glucose wash-out and a prominent rebound upon glucose wash-in. (b) The pH-corrected Perceval signal reveals a gradual decrease in cellular energy that is reversed rapidly upon glucose reapplication. Perceval occupancy of 0 corresponds to ADP ≫ ATP; occupancy of 1 corresponds to ATP ≫ ADP.

References

    1. Ashcroft FM, Gribble FM. ATP-sensitive K+ channels and insulin secretion: their role in health and disease. Diabetologia. 1999;42:903–919. - PubMed
    1. Dennis PB, Jaeschke A, Saitoh M, Fowler B, Kozma SC, Thomas G. Mammalian TOR: a homeostatic ATP sensor. Science. 2001;294:1102–1105. - PubMed
    1. Weiss JN, Lamp ST. Cardiac ATP-sensitive K+ channels. Evidence for preferential regulation by glycolysis. J Gen Physiol. 1989;94:911–935. - PMC - PubMed
    1. Hoffman JF. ATP compartmentation in human erythrocytes. Curr Opin Hematol. 1997;4:112–115. - PubMed
    1. Wilson T, Hastings JW. Bioluminescence. Annu Rev Cell Dev Biol. 1998;14:197–230. - PubMed

Publication types

MeSH terms