. 2009;4(1):e4121.
doi: 10.1371/journal.pone.0004121. Epub 2009 Jan 5.

Increase of universality in human brain during mental imagery from visual perception

Affiliations

Increase of universality in human brain during mental imagery from visual perception

Joydeep Bhattacharya. PLoS One. 2009.

Abstract

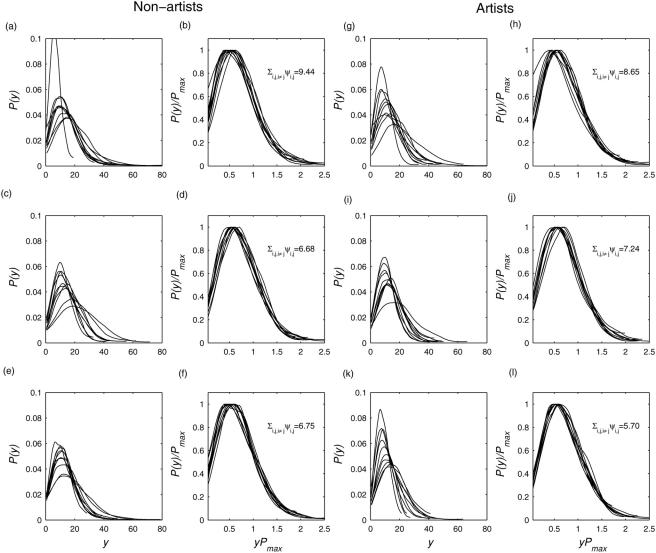
Background: Different complex systems behave in a similar way near their critical points of phase transitions which leads to an emergence of a universal scaling behaviour. Universality indirectly implies a long-range correlation between constituent subsystems. As the distributed correlated processing is a hallmark of higher complex cognition, I investigated a measure of universality in human brain during perception and mental imagery of complex real-life visual object like visual art.

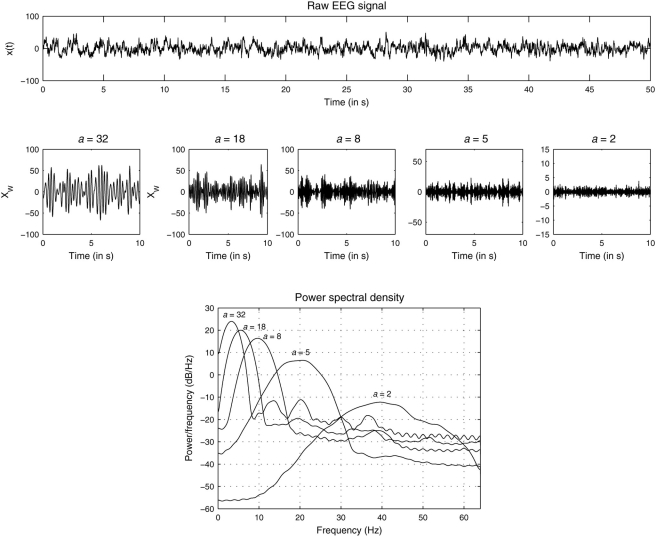
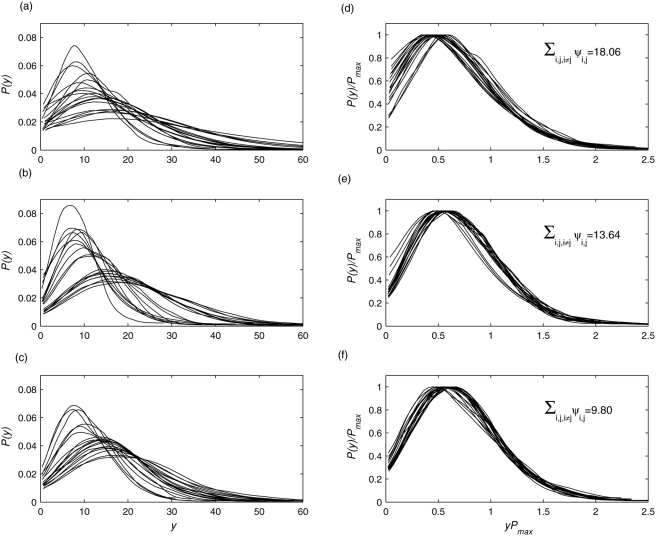
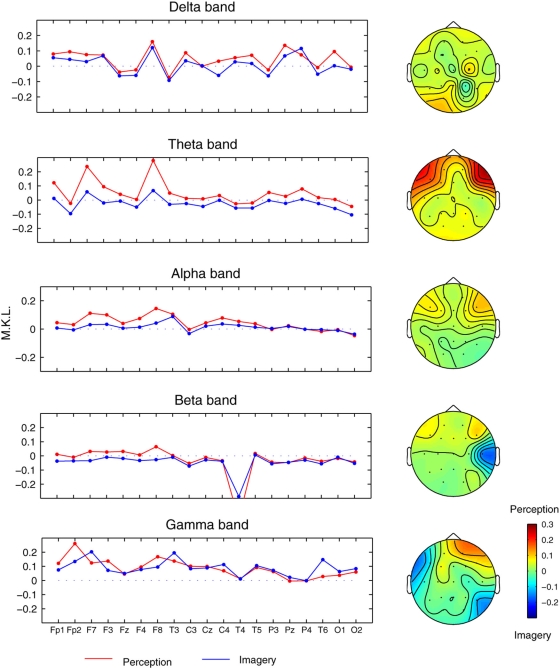
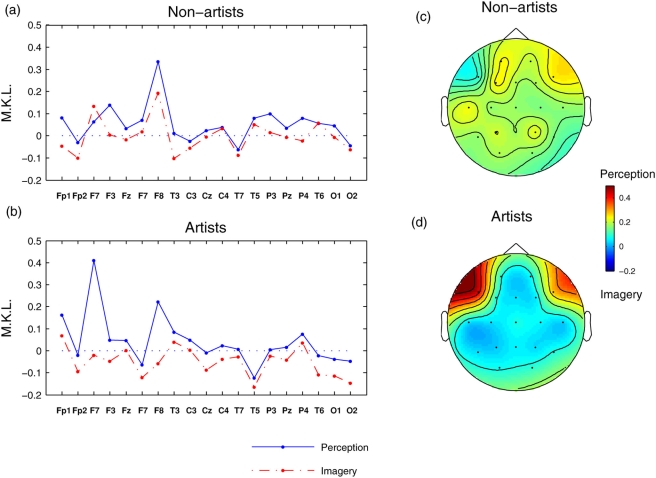
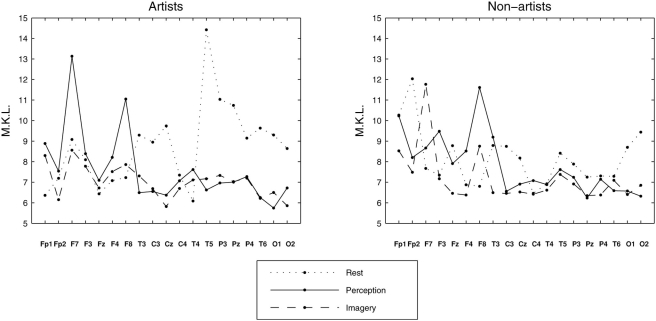
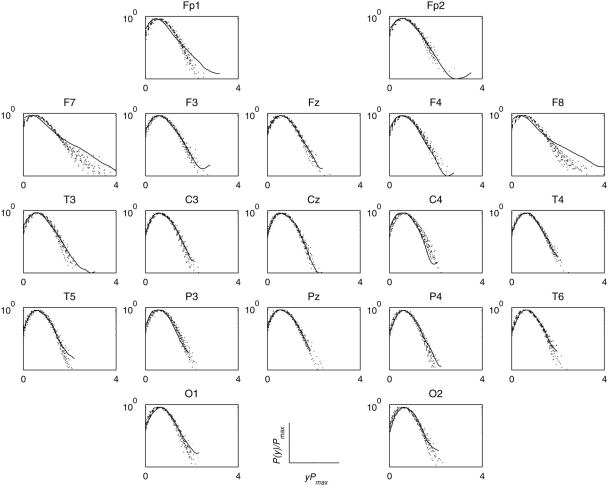
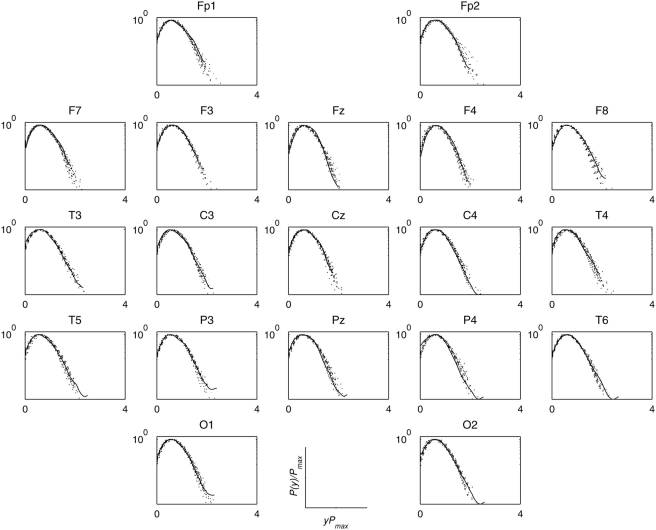
Methodology/principal findings: A new method was presented to estimate the strength of hidden universal structure in a multivariate data set. In this study, I investigated this method in the electrical activities (electroencephalogram signals) of human brain during complex cognition. Two broad groups--artists and non-artists--were studied during the encoding (perception) and retrieval (mental imagery) phases of actual paintings. Universal structure was found to be stronger in visual imagery than in visual perception, and this difference was stronger in artists than in non-artists. Further, this effect was found to be largest in the theta band oscillations and over the prefrontal regions bilaterally.

Conclusions/significance: Phase transition like dynamics was observed in the electrical activities of human brain during complex cognitive processing, and closeness to phase transition was higher in mental imagery than in real perception. Further, the effect of long-term training on the universal scaling was also demonstrated.


Conflict of interest statement

Competing Interests: The author has declared that no competing interests exist.

Figures

Figure 1
Figure 1. EEG and its (real) wavelet transformed components.
Upper panel: Segment of electroencephalogram recorded at location Pz from a participant (Vp.483) while imagining an object of visual art shown earlier. Middle: Wavelet transform Wx(a,t) of the signal shown above at five different scales a = 32, 18, 10, 5, and 2, respectively. Lower: Power-spectral densities of the wavelet transformed signals.
Figure 2
Figure 2. Universality across brain regions for all participants.
Empiriical probability density functions P(y) of the envelope of wavelet transformed coefficients at scale a = 2 for multivariate EEG signals recorded from 19 scalp locations from a participant (Vp.483) during (a) resting condition, (b) perception of a visual art object, and (c) mental imagery of the same art object. All pdfs were normalized to unit area. (d–f) Same pdfs are in (a–c) but after rescaling: P(y) by P max and y by 1/P max to preserve the normalization to unit area. The values in inset indicate the degree of data collapsing as measured by the KL divergence measure (see the text for details). Lower divergence or higher data collapse was found during mental imagery.
Figure 3
Figure 3. Universality across brain regions at different frequency bands for all participants.
Mean Kullback Leibler (MKL) divergence measure for five different scales (a = 32, 18, 10, 5, and 2) used in the wavelet transform which roughly correspond to five standard frequency bands: delta (<4 Hz), theta (5–8 Hz), alpha (9–12 Hz), beta (13–30 Hz), and gamma (>30 Hz). Results were pooled across groups, participants, electrode pairs.
Figure 4
Figure 4. Universality in theta band for artists and non-artists.
MKL divergence measure in theta band oscillations for (a) non-artists and (b) artists, respectively. The results were averaged across participants within group, electrode pairs. Note the overall decrease of divergence, i.e. increase of universality for mental imagery condition as compared to visual perception condition. (c–d) Topographical profiles for (a–b). Strongest divergence was observed in frontal regions in both hemispheres for the artists.
Figure 5
Figure 5. Universality across participants.
(a),(c),(e) Empirical probability density functions P(y) of the instantaneous amplitude of wavelet transformed coefficients at scale a = 18 for electrode O2 for a group of non-artists during resting condition, visual perception, and mental imagery, respectively. (b),(d), (f) Same pdfs as earlier but after suitable rescaling: P(y) by P max, and y by 1/P max to preserve the normalization to unit area. The values in inset indicate the degree of data collapsing as measured by the summed KL divergence measure (see the Materials and Methods for details). (g)–(l) The same as in (a)–(f) but for the group of professional artists. Stronger data collapsing were found during mental imagery.
Figure 6
Figure 6. Universality of individual brain regions across participants.
Universality across participants as measured by MKL divergence measure for the two groups, (a) artists and (b) non-artists, during three states, rest (dotted line), visual perception (solid), and mental imagery (dash-dot), respectively.
Figure 7
Figure 7. Surrogate analysis during visual perception.
Rescaled pdfs (in the semi-log scale) of the envelope of wavelet transformed coefficients at scale a = 18 for multivariate EEG signals recorded from 19 scalp locations from a participant (Vp.483) during looking at a painting and for the set ( = 19) of surrogates. The originals were shown in solid line and the surrogates in dotted lines. The long tail of the original pdfs in the frontolateral electrode regions (F7, F8) is conspicuously absent in the pdfs of their surrogates, indicating non-random phase correlations. Note other electrode regions produced.
Figure 8
Figure 8. Surrogate analysis during mental imagery.
Same as in Fig. 7 but during mental imagery. Note that the pdfs for frontal electrode regions being indistinguishable from those of surrogates and of other electrode regions, which is in sharp contrast with visual perception (Fig. 7).

References

    1. Varela F, Lachaux JP, Rodriguez E, Martinerie J. The brainweb: Phase synchronization and large-scale integration. Nature Reviews Neuroscience. 2001;2:229–239. - PubMed
    1. Bressler SL, Kelso JAS. Cortical coordination dynamics and cognition. Trends in Cognitive Sciences. 2001;5:26–36. - PubMed
    1. Schnitzler A, Gross J. Normal and pathological oscillatory communication in the brain. Nat Rev Neurosci. 2005;6:285–296. - PubMed
    1. Pereda E, Quian Quiroga R, Bhattacharya J. Nonlinear multivariate analysis of neurophysiological signals. Prog Neurobiol. 2005;77:1–37. - PubMed
    1. van Vreeswijk C, Sompolinsky H. Chaos in neuronal networks with balanced excitatory and inhibitory activity. Science. 1996;274:1724–1726. - PubMed

Publication types