

doi: 10.1016/j.mser.2008.04.004.
Peptide-based Biopolymers in Biomedicine and Biotechnology
Affiliations
- PMID: 19122836
- PMCID: PMC2575411
- DOI: 10.1016/j.mser.2008.04.004
Item in Clipboard
Peptide-based Biopolymers in Biomedicine and Biotechnology
Mater Sci Eng R Rep.
2008 Jan.
Abstract
Peptides are emerging as a new class of biomaterials due to their unique chemical, physical, and biological properties. The development of peptide-based biomaterials is driven by the convergence of protein engineering and macromolecular self-assembly. This review covers the basic principles, applications, and prospects of peptide-based biomaterials. We focus on both chemically synthesized and genetically encoded peptides, including poly-amino acids, elastin-like polypeptides, silk-like polymers and other biopolymers based on repetitive peptide motifs. Applications of these engineered biomolecules in protein purification, controlled drug delivery, tissue engineering, and biosurface engineering are discussed.
Figures

Schematics of concatemerization (A) and RDL (B). During concatemerization, a statistical distribution of genes encoding a monomer is ligated together, the gene inserts are sorted based on size, and desired insert is ligated into a vector. RDL incorporates the insert produced during a given step as the insert for the next step to ensure a given size. Figure reproduced from [62] with permission from Elsevier.
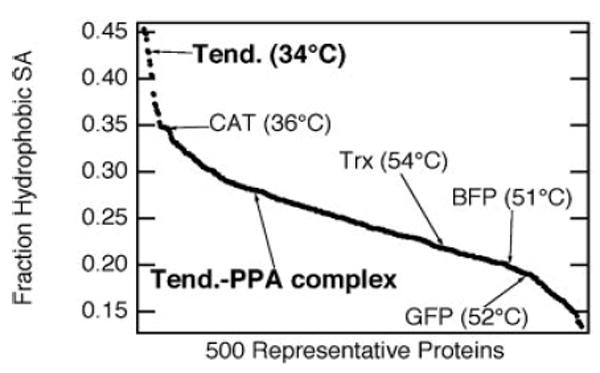
Effect of the hydrophobic fraction of solvent-accessible surface area (SAShydrophobic/SAStotal) on the Tt of ELP fusion proteins. Hydrophobic fractions of solvent-accessible surface for 500 proteins (having > 40 amino acids) selected from the protein database (PDB) are shown. The positions of five specific proteins are plotted along with their corresponding ELP fusion protein transition temperatures (at 25 μM in PBS) to show the inverse relationship between SAShydrophobic/SAStotal and Tt. Green fluorescent protein (GFP), blue fluorescent protein (BFP), thioredoxin (Trx), chloramphenicol acetyltransferase (CAT), and tendamistat (Tend) are shown. This plot also predicts that when a Tend-ELP fusion protein binds its protein partner, porcine pancreatic α-amylase (PPA), the transition temperature will increase due to the increase in hydrophobic surface area of the bound protein complex [44].

(A) Relative turbidity measurements for free ELP and ELP fusion proteins of various size. (B) The relationship between transition temperature and length of thioredoxin-ELP fusion proteins. (C) The relationship between transition temperature and NaCl concentration for the thioredoxin/60-mer ELP fusion protein (25 μM) in 50 mM phosphate buffer, pH 8.0. [69]
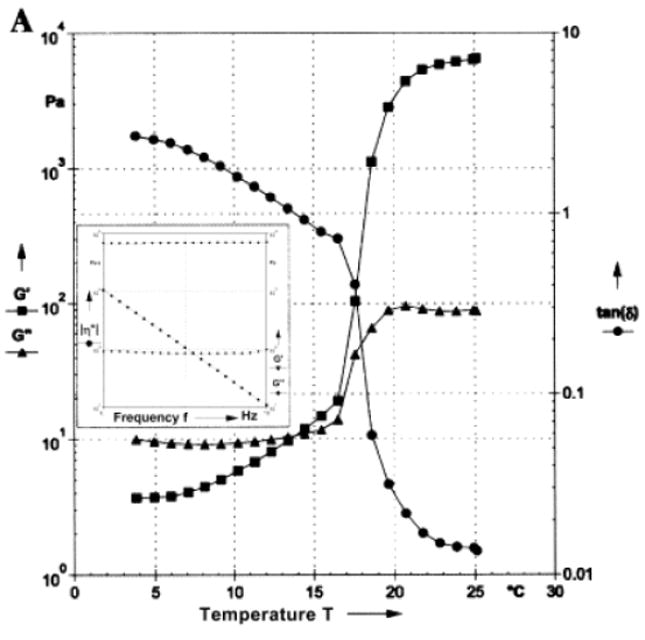
Dynamic rheological data describing the variation of the storage (G′) and loss (G″) moduli and loss angle (tan(δ)) as a function of temperature for a concentrated aqueous (25 wt.%) solution of an elastin-mimetic triblock polypeptide. The inset within the figure depicts the frequency sweep for the solution at 25 °C at a strain amplitude of 1 %. The gelation point is defined as the point where G′ and G″ cross. Below the gelation point, this polypeptide is a viscoelastic liquid (G′ < G″), and above the gelation point, it is a viscoelastic solid (G′ > G″). A loss angle approaching zero also indicates solid-like behavior. Reproduced from [70].
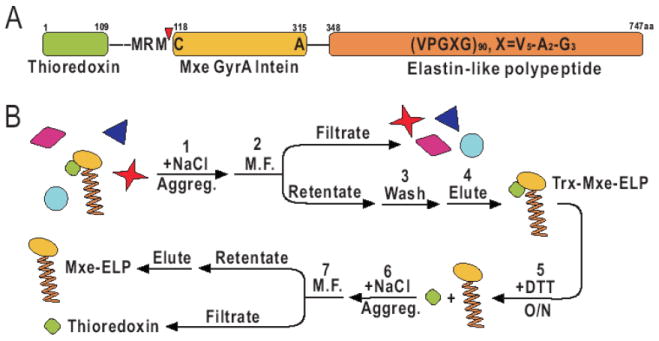
Purification of self-cleaving ELP. (A) The target protein, thioredoxin, is fused to an intein-ELP construct. (B) Purification scheme utilizing microfiltration (M.F.) The intein-ELP tag is removed from the target protein at the self-cleavage site (red arrow) by the addition of dithiothreitol (DTT). Figure reprinted from [103].

Different configurations for microfiltration purification of ELP fusion proteins by ITC. A) Syringe with a microfilter. B) AKTA system (Amersham Biosciences, Piscataway, NJ) with a microfilter. C) AKTA system with a stirred cell module. [81]

Affinity purification of plasmid DNA using thermally triggered precipitation of ELP-tagged bacterial metalloregulatory protein MerR [85].

Protein purification by glyco-affinity precipitation [86].
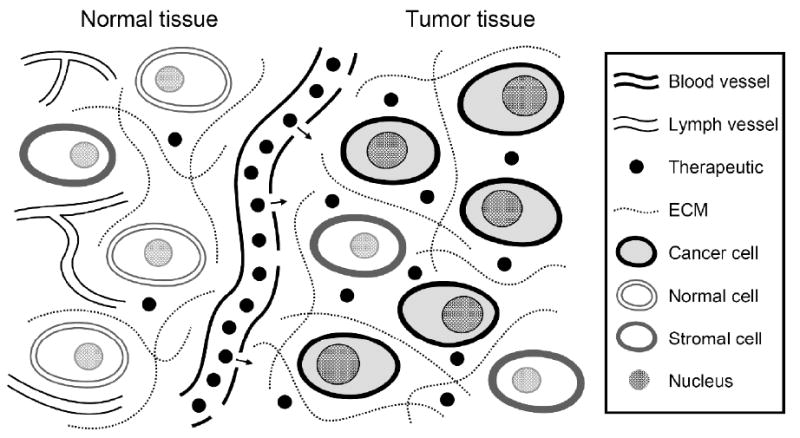
Diagram illustrating systemic drug delivery for therapy of solid tumors using the enhanced permeability and retention (EPR) effect. The drug will extravasate from the permeable tumor vasculature and diffuse across the interstitium to reach the target cells. A small portion of the drug is lost due to clearance in the bloodstream and the interstitium and due to uptake by normal tissue, but retention is enhanced within the tumor due to the lack of functional lymphatics. The goal of drug delivery is to maximize the drug concentration in the target cells while minimizing uptake by healthy cells.
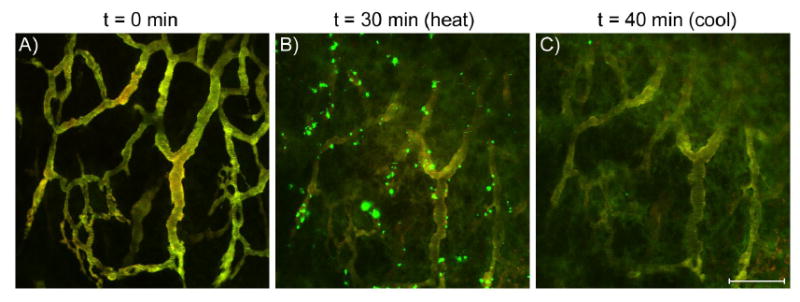
Images of ELP1 (green) and ELP2 (red) in a solid tumor before, during, and after hyperthermia treatment. These images are maximum projections along the z-axis of about 50 μm of tumor tissue, and imaging parameters were selected such that the vascular intensities of ELP1 and ELP2 were balanced to produce a yellow color. A) 0 min, no heat; B) tumor heated to 41.5 °C. The green particles indicate accumulation of ELP1; C) tumor cooled to 37 °C. The bar corresponds to 100 μm for all images. [136]
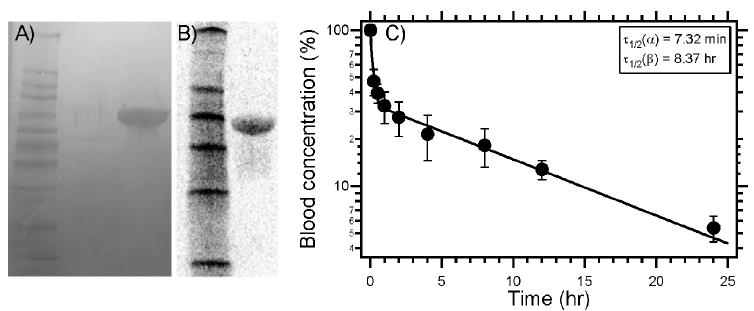
SDS-PAGE analysis of (A) C-ELP1 visualized by copper staining. (B) Radiolabeled ELP autoradiography after SDS-PAGE. (C) Pharmacokinetic analysis of radiolabeled ELP in mice (Balb/c nu/nu) exhibits a characteristic distribution and elimination response with a terminal half-life of 8.4 hr. Reprinted from [138] with permission from Elsevier.

(A) Autoradiography images of 14C-ELP1 (ELPactive) with and without heat and 14C-ELP2 (ELPpassive)with heat from 20 μm tumor sections after 1 h of hyperthermia. (B) Scintillation analysis of tumor accumulation of the 14C-ELPs. ELP1 accumulates to a greater extent in heated tumors than unheated ELP1 or heated ELP2 controls. Data are shown as mean±SEM, n=5. *Significant difference compared with both controls (Fischer’s PLSD). Reprinted from [137] with permission from Elsevier.
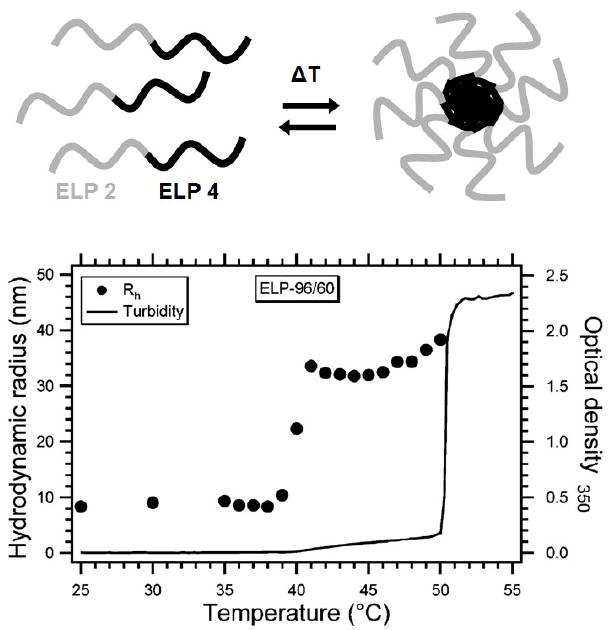
Formation of thermosensitive ELP block copolymer micelles. At temperatures below the transition temperature of the ELP4 block (< 37 °C), the copolymer remains in unimer form. At temperatures between the transition temperatures of the ELP2 and ELP4 blocks, the block copolymers self assemble into spherical nanoparticles, possibly micelles. At temperatures above the transition temperature of the ELP2 block (> 37 °C), the corona of the micelle undergoes its phase transition, and micron-sized aggregates form. The turbidity (line) and DLS (points) data show the progression of the ELP from monomer to aggregate. [182]
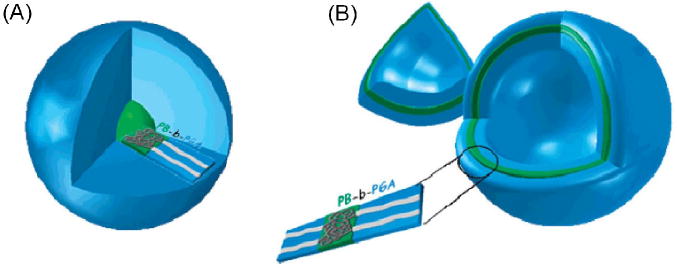
Diagram of pH-sensitive (A) micelles and (B) vesicles formed from poly(butadiene-b)-poly(glutamic acid) diblock copolymers. The hydrophilic to hydrophobic ratio of the blocks determines whether a micelle or vesicle will form. Deprotonation of glutamic acid residues in the hydrophilic corona imparts pH sensitivity to these structures. Reproduced from [155].
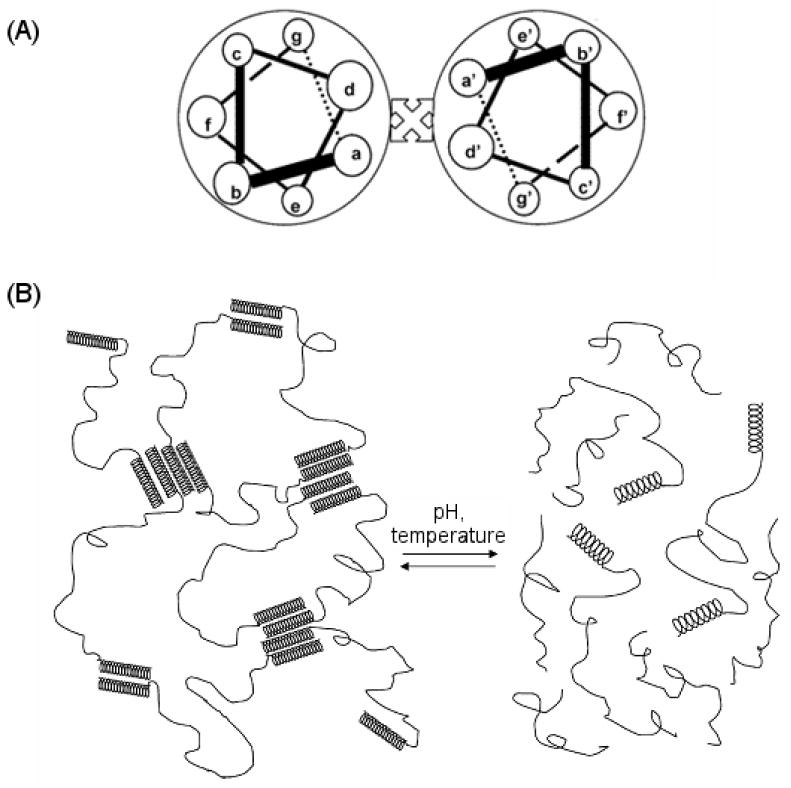
Schematic showing the design of coiled-coil polypeptide hydrogels. (A) The α-helices are formed from heptamer repeats. The helix bundles are formed by interhelical hydrophobic interaction between residues a and d and stabilized by interhelical electrostatic interactions between residues g and e. (B) Variations in pH and temperature can disrupt these interactions and cause reversible dissolution of the hydrogel. Reprinted with permission from [176]. Copyright 2005 American Chemical Society.
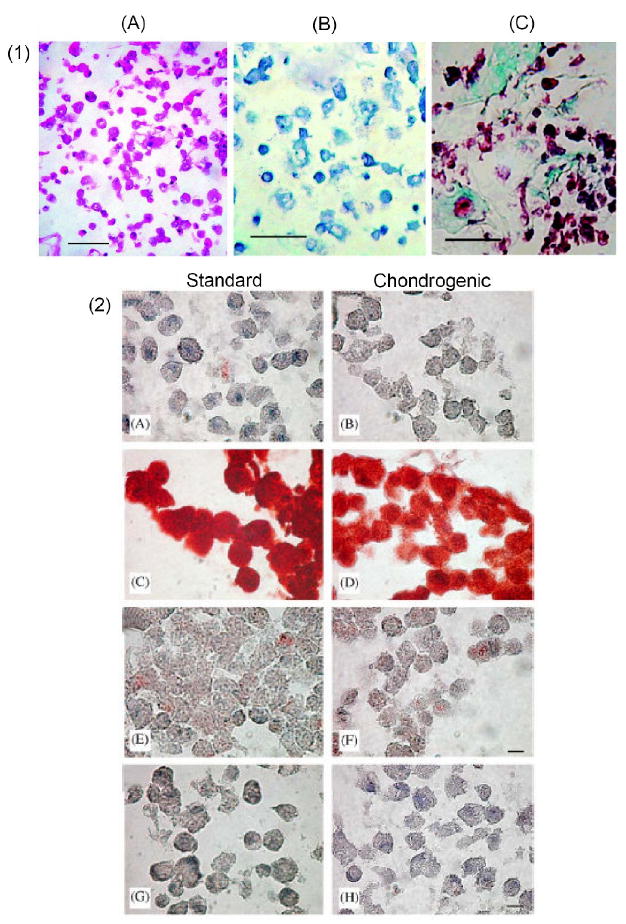
(1) Histological section of ELP-chondrocyte constructs after 15 days of culture. Sections stained for: (A) cell morphology, H&E, (B), S-GAG using toluidine blue, and (C) collagen and extracellular matrix using Masson’s trichrome. The scale bar is 50 μm [198]. (2) Immunohistochemical staining of the human adipose-derived adult stem cells (hADAS). ELP constructs after 14 days of culture in standard (A, C, E and G) or chondrogenic (B, D, F and H) media at 5% O2. Sections stained for anti-type I collagen (A and B), anti-type II collagen (C and D) and antichondroitin-4-sulfate (E and F). Negative control (no primary antibody) is shown in G and H. (bar, 50 mm) [199].

(A) Schematic representations of triblock proteins and the amino acid sequences of major domains. The major domains of each triblock protein are joined by short sequences of amino acids introduced in the construction of the cloning and expression vectors. (B) Structural and dynamic properties underlying the fast erosion of symmetric-endblock hydrogels. (a) Disengaged clusters form readily in the system because of the strong tendency towards intramolecular association. The clusters are lost from the surface through diffusion before reconnecting to the network. (b) Three possible states of tetrameric aggregates designated by the number of loops i. Reproduced from [211].
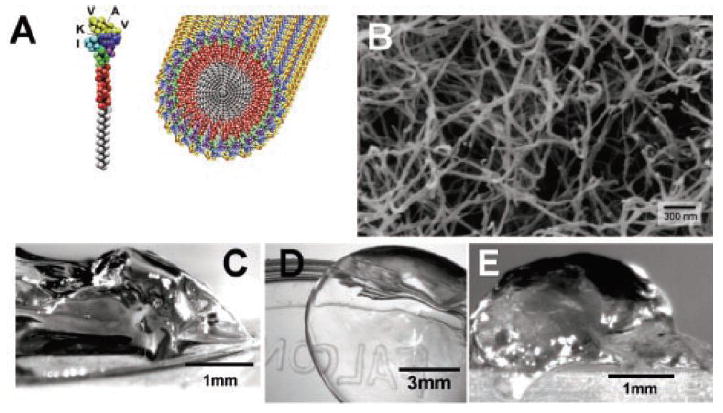
(A) Molecular graphics illustration of an IKVAV-containing peptide amphiphile molecule and its self-assembly into nano-fibers. (B) Scanning electron micrograph of an IKVAV nanofiber network formed by adding cell media (DMEM) to a peptide amphiphile aqueous solution. The sample in the image was obtained by network dehydration and critical point drying of samples caged in a metal grid to prevent network collapse. Micrographs of the gel formed by adding IKVAV peptide amphiphile solutions to (C) cell culture media and (D) cerebral spinal fluid. (E) Micrograph of an IKVAV nanofiber gel surgically extracted from an enucleated rat eye after intraocular injection of the peptide amphiphile solution [212].
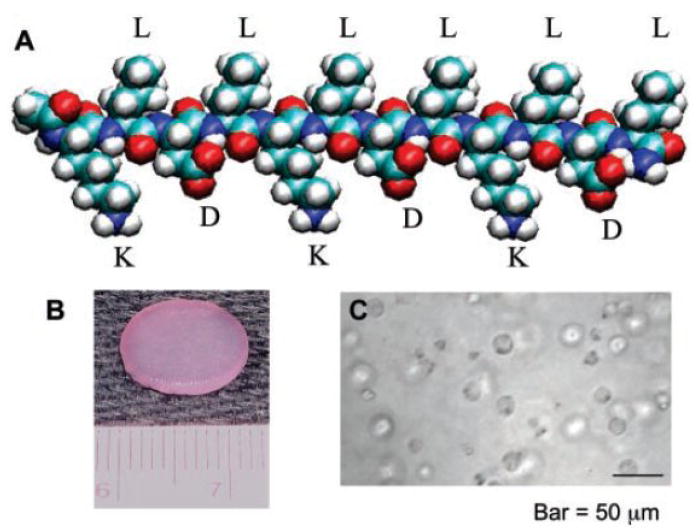
(A) Molecular model of a single β-sheet forming ionic oligopeptide. The alternating hydrophobic and hydrophilic residues on the backbone promote β-sheet formation. The positively charged lysines (K) and negatively charged aspartic acids (D) are on the lower side of the β-sheet, and the hydrophobic leucines (L) are on the upper side. This molecular structure facilitates self-assembly into nanofibers and hydrogel matrices through intermolecular interactions. (B) A 12-mm chondrocyte-seeded peptide hydrogel plug, punched from a 1.6-mm-thick slab. (C) Light microscope image of chondrocytes encapsulated in a peptide hydrogel [225].
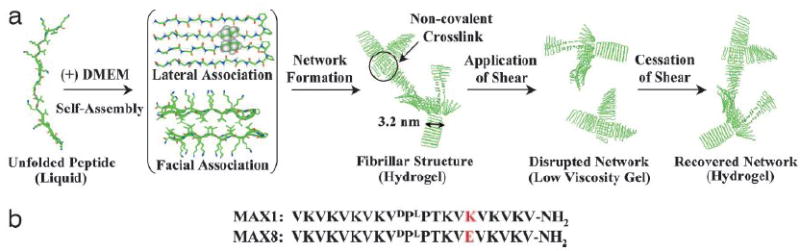
Self-assembly, shear-thinning, and self-healing mechanism allowing rapid formation of hydrogels that can be subsequently syringe-delivered. (a) Addition of cell culture buffer DMEM (pH 7.4, 37°C) to a buffered solution (25 mM Hepes, pH 7.4) of unfolded peptide induces formation of a β-hairpin structure that undergoes lateral and facial self-assembly affording a rigid hydrogel with a fibrillar supramolecular structure. Subsequent application of shear stress disrupts the noncovalently stabilized network, leading to the conversion of the hydrogel to a low-viscosity gel. Upon cessation of shear stress, the network structure recovers, converting the liquid back to a rigid hydrogel. (b) Peptide sequences of two β-hairpin molecules: MAX1 and MAX8. MAX8 has a net positive charge that is two less than that of MAX1 due to the substitution of one negatively charged glutamic acid residue for one positively charged lysine residue. The lower net positive charge allows MAX8 to undergo rapid gelation. Reproduced from [245].

Schematic of the inter- or intramolecular crosslinking mechanism using THPP to connect lysine residues in ELPs. This biocompatible reaction can be carried out in aqueous solution, has only water as a byproduct, and is non-cytotoxic. The gelation occurs rapidly, allowing for the use of these gels as injectable biomaterials, and the mehanical properties of fully stabilized gels approach those of cartilaginous tissues. In addition, the THPP crosslinking sites present reactive carboxylic acids that may be used for the further introduction of biological moieties into the hydrogels. [260]

(A) Schematic of protein-PEG network formation. The recombinant protein polymer contains RGD integrin-binding cell adhesion sites, MMP and plasmin degradation sites, and several cysteine residues for crosslinking. (B) Radiographic (left) and three-dimensional microcomputed tomography images (right) of the bone formation in rat calvarial defects after treatment with protein-PEG hydrogels. Group I: Degradable matrix with BMP-2; Group II: Non-degradable matrix with BMP-2; Group III: Degradable matrix without BMP-2; Group IV: Non-degradable matrix without BMP-2. In Group I, bone was prevalently observed to have replaced the matrix. A similar bone volume was measured in Group II, but the bone was confined at matrix surface. Reproduced from [285].

Fabrication of multiplex antibody microarrays. (a) Antibodies are captured by ELP-Protein A, G, or L fusions and collected by centrifugation. Separation of bound and unbound antibodies was followed by the resolubilization of the pellet to yield purified proteins, which are then spotted on microarrays. (b) Image of microarrays with immobilized antibodies of different species (rabbit, goat, and mouse) captured by ELP-Protein A, G or L fusion proteins, respectively. (c) Comparison of the relative fluorescence intensities detected from the immobilized complexes with no NaCl added, with 2 M NaCl added, and after washing with 4 °C PBS. Reproduced from [83].

ELP nanoarray generated by dip pen nanolithography (DPN). (a) Atomic force microscopy tapping mode image of ELP dot array in PBS buffer at room temperature. (b) Close-up image of the area highlighted in (a) and a cross section showing a feature height of 5-6 nm and a lateral feature size of about 200 nm. Reproduced from [347].
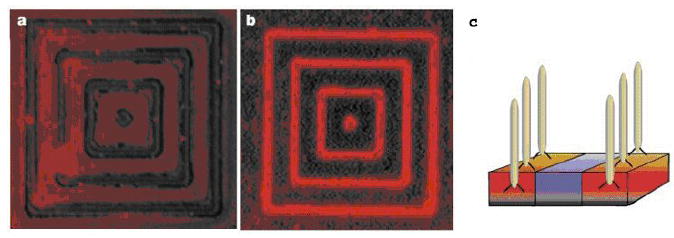
Specific recognition of semiconductor materials by bacterial phages. (a) Fluorescent image showing minimal background fluorescent signal due to the presence of primary antibody and streptavidin-tetramethyl rhodamine. (b) Fluorescent image showing binding of fluorescently labeled phage clone G12-3 to GaAs. One mm GaAs lines spaced with 4 mm SiO2 are patterned on the surface. (c) Schematic of bacterial phages binding specifically to the GaAs semi-conductor instead of the silicon substrate. Reproduced from [369].
References
-
- Burkhard P, Stetefeld J, Strelkov SV. Trends In Cell Biology. 2001;11:82. - PubMed
-
- DeGrado WF, Summa CM, Pavone V, Nastri F, Lombardi A. Annual Review Of Biochemistry. 1999;68:779. - PubMed
-
- Debelle L, Tamburro AM. International Journal Of Biochemistry & Cell Biology. 1999;31:261. - PubMed
-
- Iozzo RV. Annual Review Of Biochemistry. 1998;67:609. - PubMed
-
- Bryson JW, Betz SF, Lu HS, Suich DJ, Zhou HXX, Oneil KT, Degrado WF. Science. 1995;270:935. - PubMed
Grants and funding
LinkOut - more resources
Full Text Sources
Other Literature Sources