. 2009 Jun;24(6):1043-54.
doi: 10.1359/jbmr.090101.

Thrombospondin-2 influences the proportion of cartilage and bone during fracture healing

Affiliations

Thrombospondin-2 influences the proportion of cartilage and bone during fracture healing

Douglas K Taylor et al. J Bone Miner Res. 2009 Jun.

Abstract

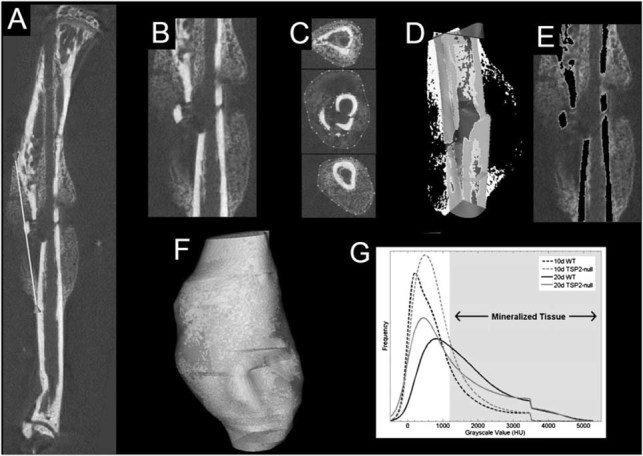
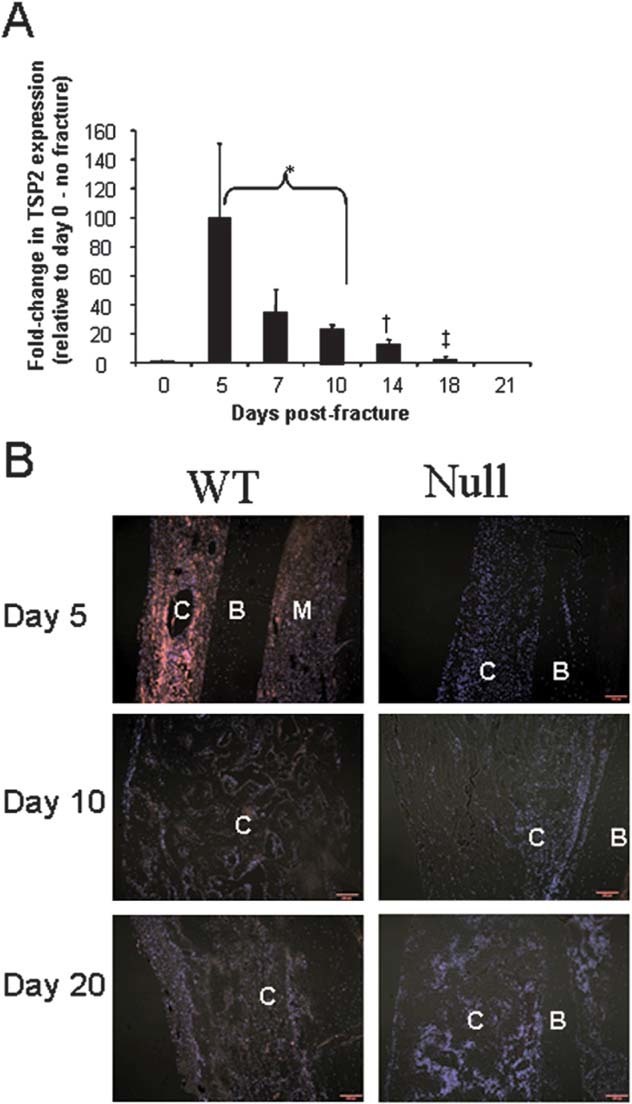
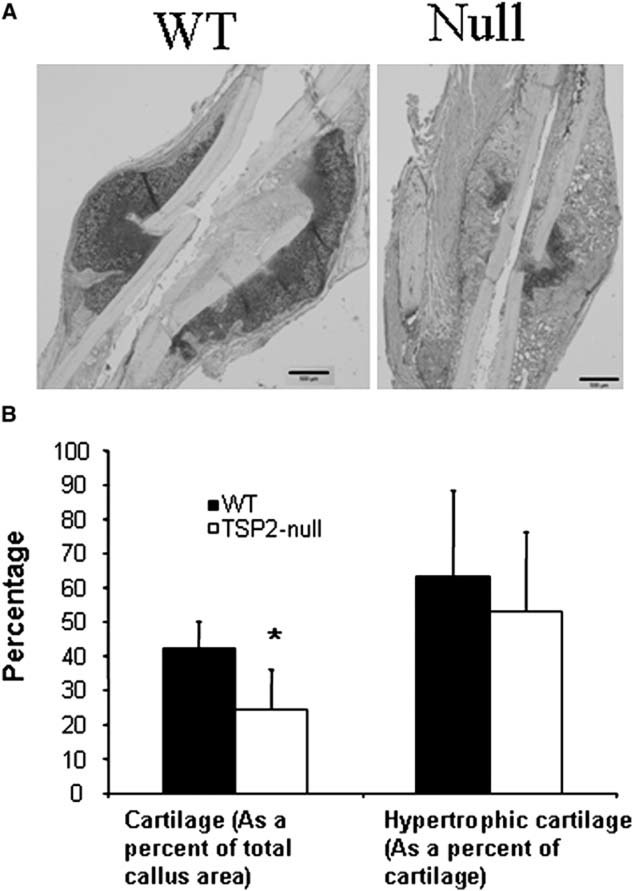
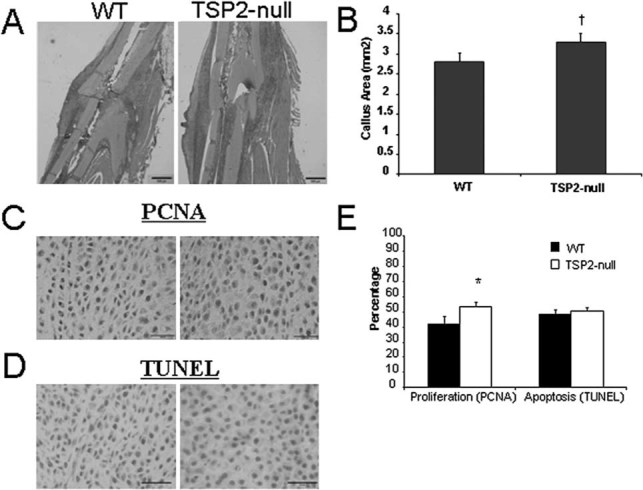
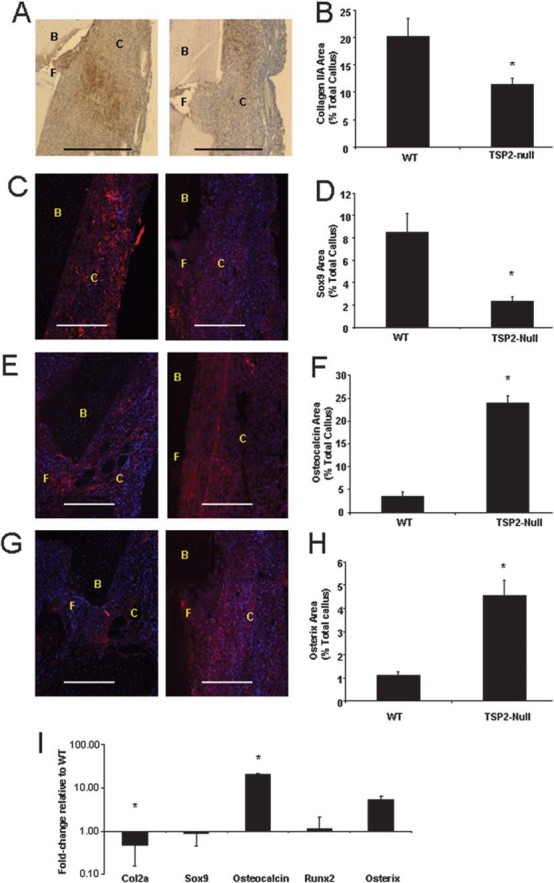
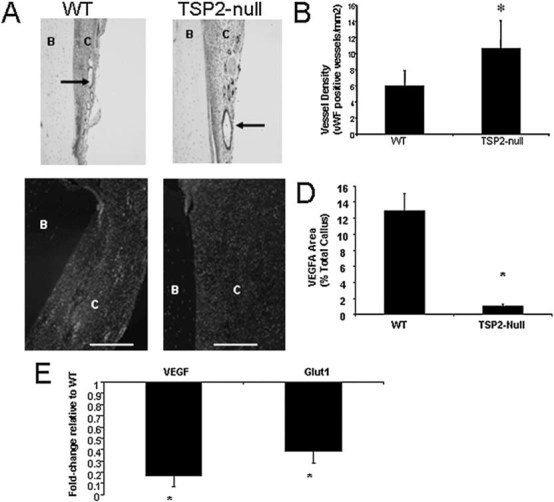
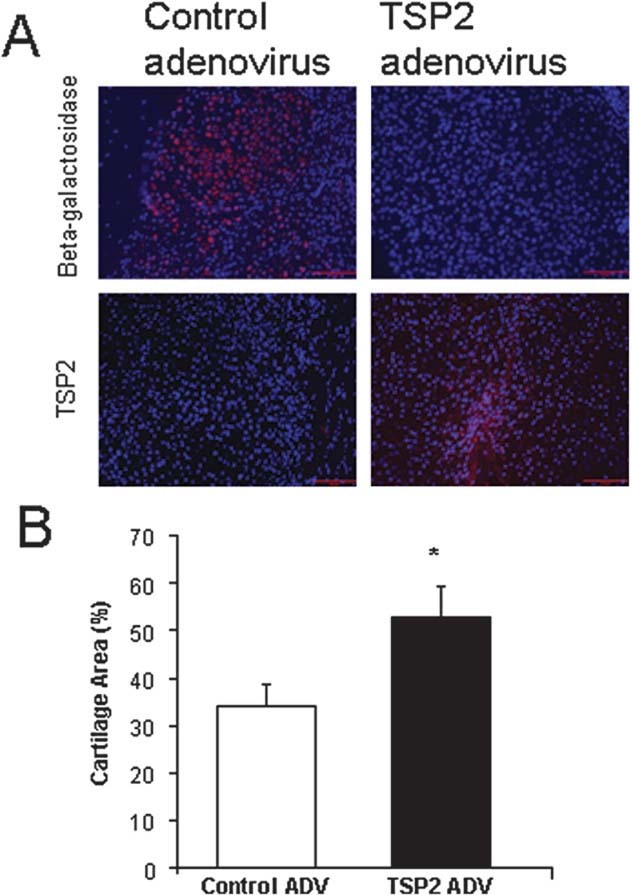
Thrombospondin-2 (TSP2) is a matricellular protein with increased expression during growth and regeneration. TSP2-null mice show accelerated dermal wound healing and enhanced bone formation. We hypothesized that bone regeneration would be enhanced in the absence of TSP2. Closed, semistabilized transverse fractures were created in the tibias of wildtype (WT) and TSP2-null mice. The fractures were examined 5, 10, and 20 days after fracture using microCT, histology, immunohistochemistry, quantitative RT-PCR, and torsional mechanical testing. Ten days after fracture, TSP2-null mice showed 30% more bone by microCT and 40% less cartilage by histology. Twenty days after fracture, TSP2-null mice showed reduced bone volume fraction and BMD. Mice were examined 5 days after fracture during the stage of neovascularization and mesenchymal cell influx to determine a cellular explanation for the phenotype. TSP2-null mice showed increased cell proliferation with no difference in apoptosis in the highly cellular fracture callus. Although mature bone and cartilage is minimal 5 days after fracture, TSP2-null mice had reduced expression of collagen IIa and Sox9 (chondrocyte differentiation markers) but increased expression of osteocalcin and osterix (osteoblast differentiation markers). Importantly, TSP2-null mice had a 2-fold increase in vessel density that corresponded with a reduction in vascular endothelial growth factor (VEGF) and Glut-1 (markers of hypoxia inducible factor [HIF]-regulated transcription). Finally, by expressing TSP2 using adenovirus starting 3 days after fracture, chondrogenesis was restored in TSP2-null mice. We hypothesize that TSP2 expressed by cells in the fracture mesenchyme regulates callus vascularization. The increase in vascularity increases tissue oxemia and decreases HIF; thus, undifferentiated cells in the callus develop into osteoblasts rather than chondrocytes. This leads to an alternative strategy for achieving fracture healing with reduced endochondral ossification and enhanced appositional bone formation. Controlling the ratio of cartilage to bone during fracture healing has important implications for expediting healing or promoting regeneration in nonunions.


Figures

FIG. 1
FIG. 1
Quantification of callus length, total volume, and bone volume using μCT. (A) Anterior callus length was measured in all specimens (white line). (B) Next, using the maximum callus length, the callus was cropped from the image. (C) Splines were separately traced around the cortical bone and callus. (D) The spline around the cortical bone served as a confining region for a region growing algorithm based on a global threshold (the image shown is binarized at this threshold) that finds all connected cortical bone voxels (the cortical bone that is detected is shown in grey); callus bone is white. (E) The cortical bone voxels are removed from the image by region blanking (gray voxels in (D) becomes black in (E). (F) A final 3D isosurface rendering showing the callus and the region used to analyze the bone that it contains. (G) A histogram of the grayscale values was plotted for callus bone in every specimen. The curves shown are the average of all mice within a particular treatment group and time point. The curve for TSP2-null mice is higher after 10 days, indicating that more bone is present at this time point. After 20 days, the curve for TSP2-null mice is lower, indicating that these mice have less bone in the callus. The shaded region indicates the region used to separate mineralized voxels from unmineralized voxels; the shaded region is used for TMC and TMD calculations, whereas the entire histogram is used for BMC and BMD calculations. The drop-off in the histogram near a grayscale value of 3500 HU is because of the removal of dense bone (which was predominantly residual cortical bone from the original cortices) from the image.
FIG. 2
FIG. 2
TSP2 expression is increased during early bone regeneration. (A) TSP2 gene expression was characterized at 0, 5, 7, 10, 14, 18, and 21 days after fracture and fold-change in expression was compared with nonfractured bone. *Values are not significantly different (p < 0.05) from each other, but are significantly different from all other values, with the exception that the difference between day 14 and day 7 is not significant; significantly different (p < 0.05) from all other values except day 7; significantly different from all values with the exception day 0. Bars represent mean and error bars represent SD. n = 3. (B) Composite image showing TSP2 detection in vivo using immunofluorescence (magnification bar = 100 μm). Red indicates areas of TSP2 expression, and cell nuclei are shown in blue (B, bone; C, callus; M, marrow).
FIG. 3
FIG. 3
TSP2-null mice have significantly less callus cartilage than WT mice 10 days after fracture. (A) Safranin-O–stained sections of midcallus showing cartilage areas (dark staining) in WT and TSP2-null mice (magnification bar = 500 μm). (B) The percentage of the callus that is cartilage and the percent of cartilage that is hypertrophic was determined using Bioquant image analysis system. Values are mean ± SE of WT (n = 14) and TSP2-null (n = 13) mice. *Significantly different from WT (p < 0.05).
FIG. 4
FIG. 4
TSP2-null fractures 5 days after fracture show increased callus size and enhanced mesenchymal cell proliferation. (A) Safranin-O–strained tissues showing appearance of provisional callus but an absence of mature cartilage at 5 dpf (magnification bar = 500 μm). Note that Safranin-O staining at this time is generally nonspecific staining of provisional matrix and not bright red relative to the appearance of cartilage in Fig. 3. (B) Area of the fracture callus determined using histomorphometry is slightly greater in TSP2-null mice compared with WT. (C) PCNA expression was examined to evaluate the proliferation of mesenchymal cells. Brown nuclei are PCNA positive (magnification bar = 100 μm). (D) TUNEL was used to evaluate cells undergoing apoptosis. Brown nuclei are TUNEL+ (magnification bar = 100 μm). (E) PCNA staining is greater in the fracture callus of TSP2-null mice compared with WT mice, but there is no difference in TUNEL. Values are mean ± SE of WT (n = 13) and TSP2-null (n = 12) mice. *Significantly different from WT (p < 0.05).
FIG. 5
FIG. 5
The fracture callus of TSP2-null mice 5 days after fracture has reduced chondrogenesis and increased osteoblast differentiation. Immunohistochemistry and histomorphometry were used to examine the differentiation of mesenchymal cells in the 5d calluses. (A and B) Type IIa collagen and (C and D) Sox9 expression were evaluated to determine areas of neochondrogenesis, whereas (E and F) osteocalcin and (G and H) osterix expression were used to indicate areas of new bone formation (magnification bar = 100 μm). Positive staining is either brown (A) or red (C, E, and G). Blue staining in C, E, and G represents DAPI-stained nuclei. B, bone; C, callus tissue; F, fracture. Values are mean ± SE of WT (n = 13) and TSP2-null (n = 12) mice. *Significantly different from WT; p < 0.05. (I) RNA was extracted from day 5 calluses and gene expression was evaluated using quantitative real-time PCR. Values are mean ± SE of fold-change in TSP2-null (n = 6) compared with WT mice (n = 5); *ΔCT significantly different from WT (p < 0.05).
FIG. 6
FIG. 6
TSP2-null fractures show increased angiogenesis and a reduction in markers associated with HIF1-α activity. (A and B) Blood vessel density was determined by counting the total number of vWF-positive vessels in the callus (arrows). (B) Blood vessel density is 75% greater in the callus of TSP2-null mice compared with WT mice. (C and D) VEGF expression in calluses was evaluated using immunofluorescence (magnification bar = 100 μm). B, bone; C, callus tissue; F, fracture. Values are mean ± SE of WT (n = 13) and TSP2-null (n = 12) mice. *Significantly different from WT (p < 0.05). (E) RNA was extracted from day 5 calluses and gene expression was evaluated using quantitative real-time PCR. Values are mean ± SE of fold-change in TSP2-null (n = 6) compared with WT mice (n = 5). *ΔCT significantly different from WT (p < 0.05).
FIG. 7
FIG. 7
Delivery of TSP2 to TSP2-null mice promotes endochondral bone formation. (A) TSP2 was delivered locally, unilaterally to fractured tibia using adenovirus at 3 days after fracture. The opposite limb received a LacZ control virus. TSP2 or β-galactosidase expression was determined using immunofluorescence (red staining; magnification bar = 100 μm). Blue staining is DAPI+ nuclei. (B) Cartilage content was measured using histomorphometry at day 10. Values are mean ± SE of control (n = 7) and TSP2-null + TSP2 ADV (n = 7) mice. *Significantly different from control (p < 0.05).

References

    1. Einhorn TA. The cell and molecular biology of fracture healing. Clin Orthop Relat Res. 1998;355(Suppl):S7–S21. - PubMed
    1. Li G, White G, Connolly C, Marsh D. Cell proliferation and apoptosis during fracture healing. J Bone Miner Res. 2002;17:791–799. - PubMed
    1. Ford JL, Robinson DE, Scammell BE. The fate of soft callus chondrocytes during long bone fracture repair. J Orthop Res. 2003;21:54–61. - PubMed
    1. Gerstenfeld LC, Cullinane DM, Barnes GL, Graves DT, Einhorn TA. Fracture healing as a post-natal developmental process: Molecular, spatial, and temporal aspects of its regulation. J Cell Biochem. 2003;88:873–884. - PubMed
    1. Street J, Bao M, deGuzman L, Bunting S, Peale FV, Jr, Ferrara N, Steinmetz H, Hoeffel J, Cleland JL, Daugherty A, van Bruggen N, Redmond HP, Carano RA, Filvaroff EH. Vascular endothelial growth factor stimulates bone repair by promoting angiogenesis and bone turnover. Proc Natl Acad Sci USA. 2002;99:9656–9661. - PMC - PubMed

Publication types