

GenomeGraphs: integrated genomic data visualization with R
- PMID: 19123956
- PMCID: PMC2629762
- DOI: 10.1186/1471-2105-10-2
GenomeGraphs: integrated genomic data visualization with R
Abstract
Background: Biological studies involve a growing number of distinct high-throughput experiments to characterize samples of interest. There is a lack of methods to visualize these different genomic datasets in a versatile manner. In addition, genomic data analysis requires integrated visualization of experimental data along with constantly changing genomic annotation and statistical analyses.
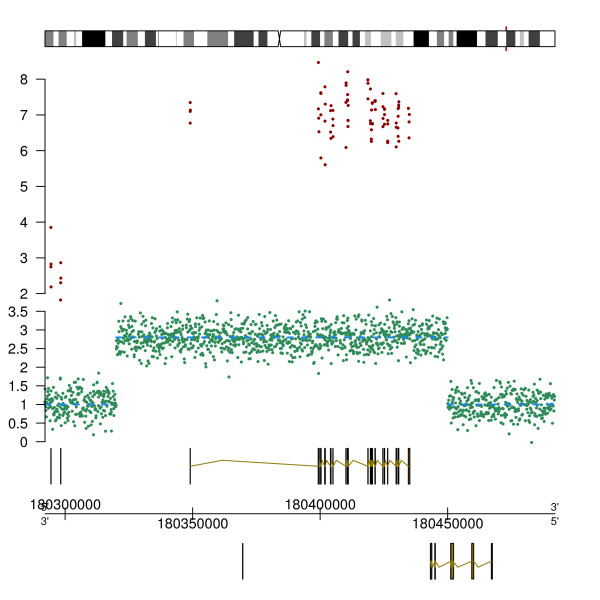
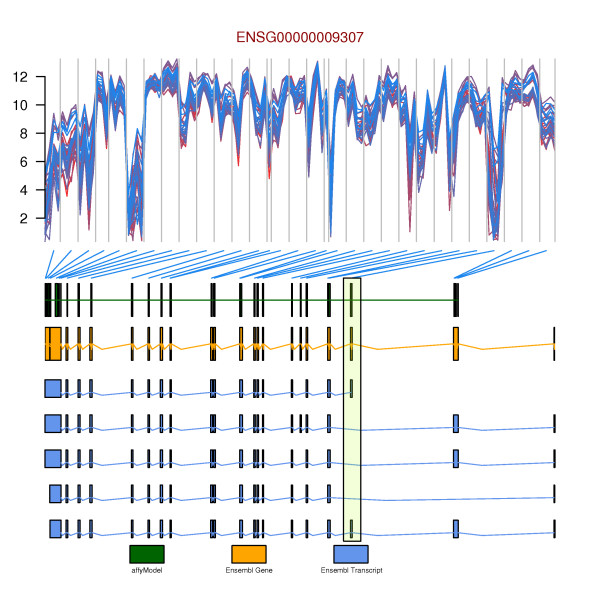
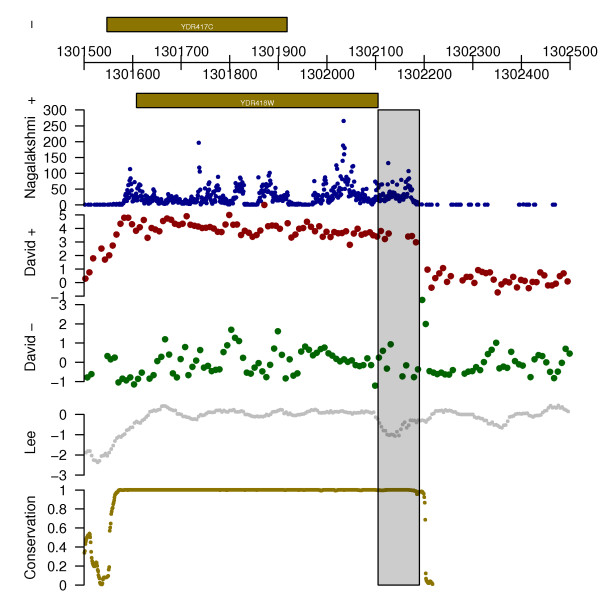
Results: We developed GenomeGraphs, as an add-on software package for the statistical programming environment R, to facilitate integrated visualization of genomic datasets. GenomeGraphs uses the biomaRt package to perform on-line annotation queries to Ensembl and translates these to gene/transcript structures in viewports of the grid graphics package. This allows genomic annotation to be plotted together with experimental data. GenomeGraphs can also be used to plot custom annotation tracks in combination with different experimental data types together in one plot using the same genomic coordinate system.
Conclusion: GenomeGraphs is a flexible and extensible software package which can be used to visualize a multitude of genomic datasets within the statistical programming environment R.
Figures
References
-
- Hubbard T, Aken B, Ayling S, Ballester B, Beal K, Bragin E, Brent S, Chen Y, Clapham P, Clarke L, Coates G, Fairley S, Fitzgerald S, Fernandez-Banet J, Gordon L, Graf S, Haider S, Hammond M, Holland R, Howe K, Jenkinson A, Johnson N, Kahari A, Keefe D, Keenan S, Kinsella R, Kokocinski F, Kulesha E, Lawson D, Longden I, et al. Ensembl 2009. Nucleic Acids Res. 2009:D690–697. doi: 10.1093/nar/gkn828. - DOI - PMC - PubMed
-
- Wheeler D, Barrett T, Benson D, Bryant S, Canese K, Chetvernin V, Church D, Dicuccio M, Edgar R, Federhen S, Feolo M, Geer L, Helmberg W, Kapustin Y, Khovayko O, Landsman D, Lipman D, Madden T, Maglott D, Miller V, Ostell J, Pruitt K, Schuler G, Shumway M, Sequeira E, Sherry S, Sirotkin K, Souvorov A, Starchenko G, Tatusov R, et al. Database resources of the National Center for Biotechnology Information. Nucleic Acids Research. 2008:D780–D786. - PMC - PubMed
-
- Karolchik D, Kuhn R, Baertsch R, Barber G, Clawson H, Diekhans M, Giardine B, Harte R, Hinrichs A, Hsu F, Kober K, Miller W, Pedersen J, Pohl A, Raney B, Rhead B, Rosenbloom K, Smith K, Stanke M, Thakkapallayil A, Trumbower H, Wang T, Zweig A, Haussler D, Kent W. The UCSC Genome Browser Database: 2008 update. Nucleic Acids Research. 2008:D773–D779. - PMC - PubMed
-
- Stenger J, Xu H, Haynes C, Hauser E, Pericak-Vance M, Goldschmidt-Clermont P, Vance J. Statistical Viewer: a tool to upload and integrate linkage and association data as plots displayed within the Ensembl genome browser. BMC Bioinformatics. 2005;6:95. doi: 10.1186/1471-2105-6-95. - DOI - PMC - PubMed
Publication types
MeSH terms
Substances
Grants and funding
LinkOut - more resources
Full Text Sources
Other Literature Sources
Molecular Biology Databases
