. 2009 Mar;29(6):1608-25.
doi: 10.1128/MCB.01339-08. Epub 2009 Jan 5.

TRF1 controls telomere length and mitotic fidelity in epithelial homeostasis

Affiliations

TRF1 controls telomere length and mitotic fidelity in epithelial homeostasis

Purificacion Muñoz et al. Mol Cell Biol. 2009 Mar.

Abstract

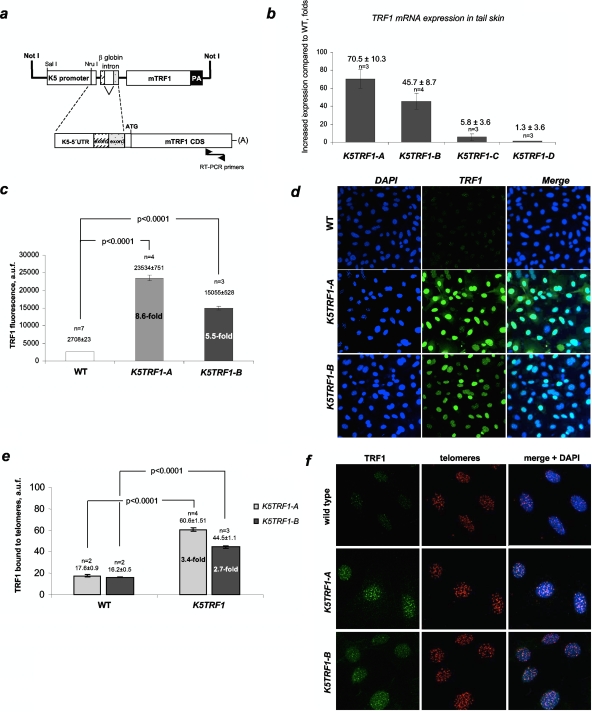
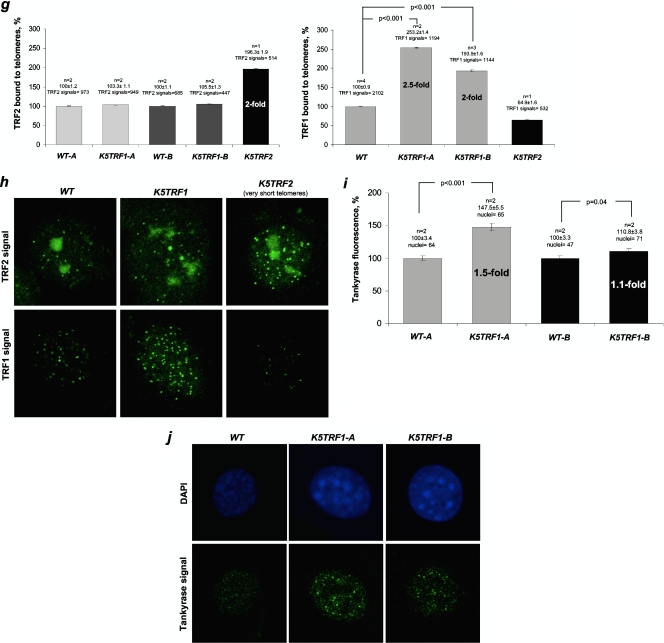
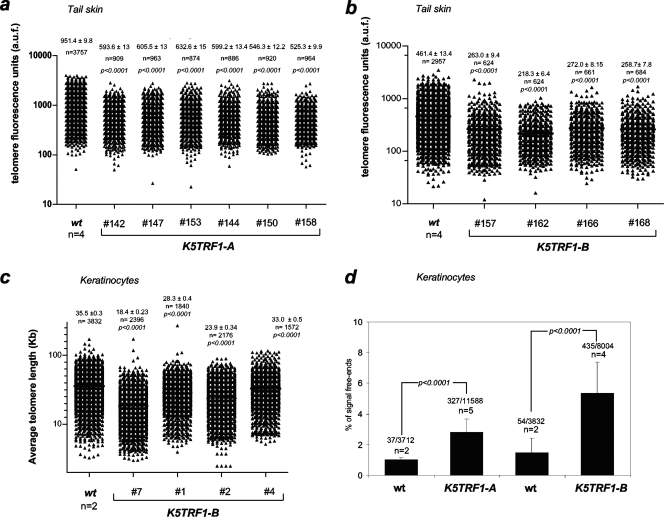
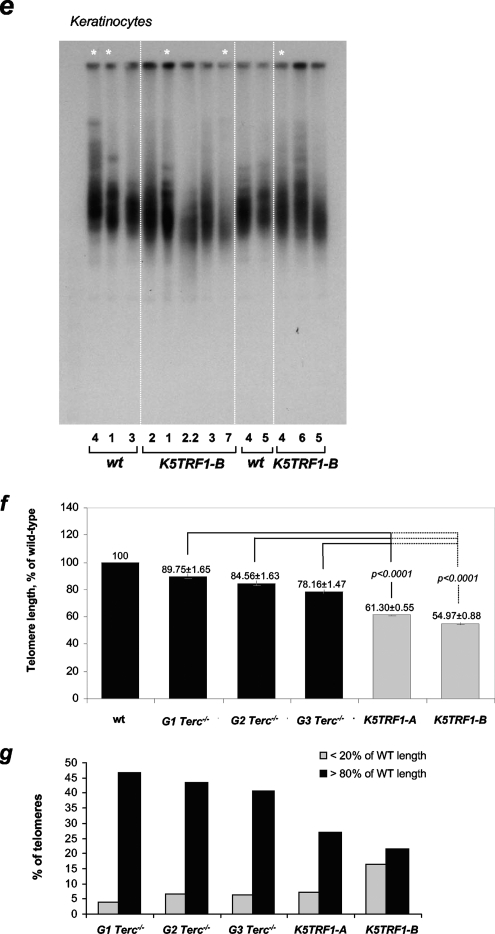
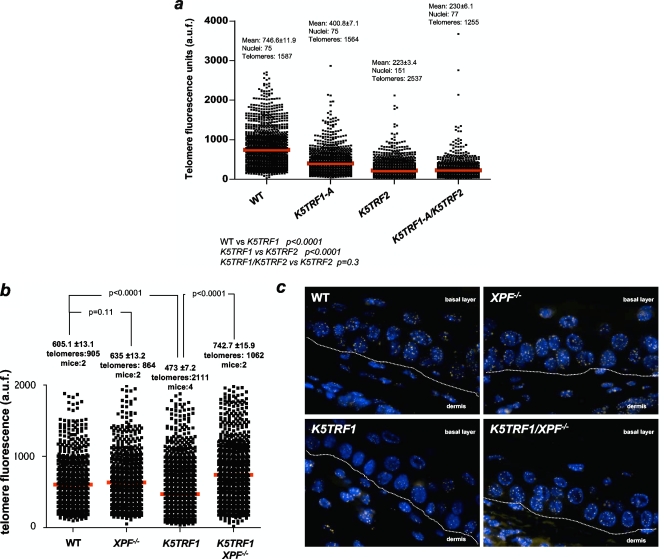
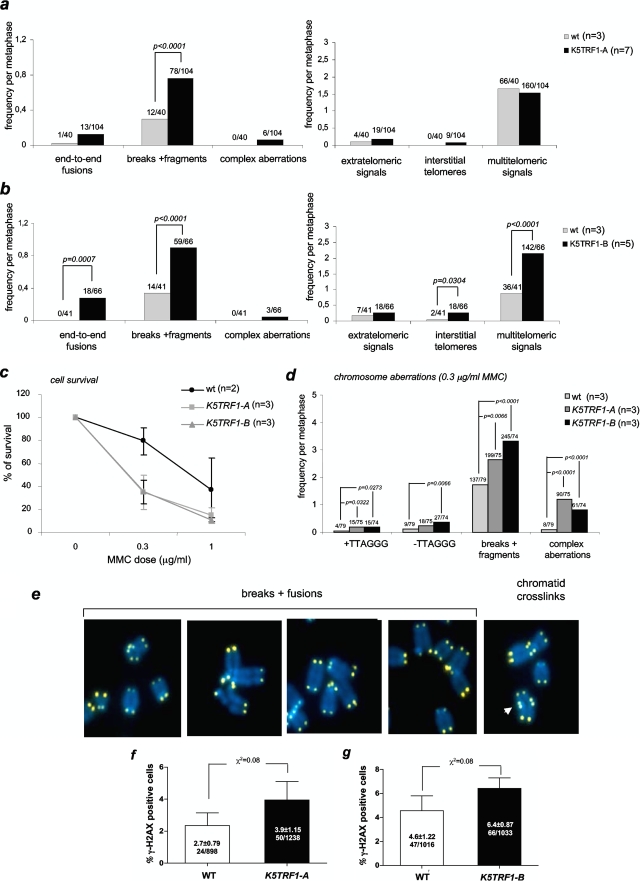
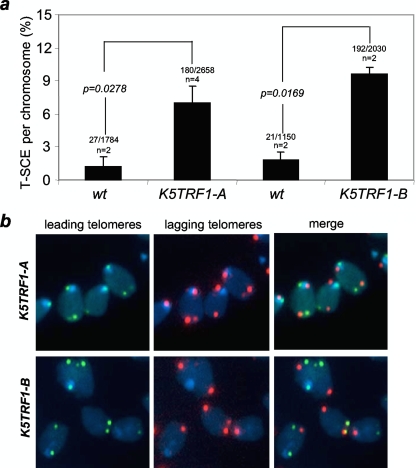
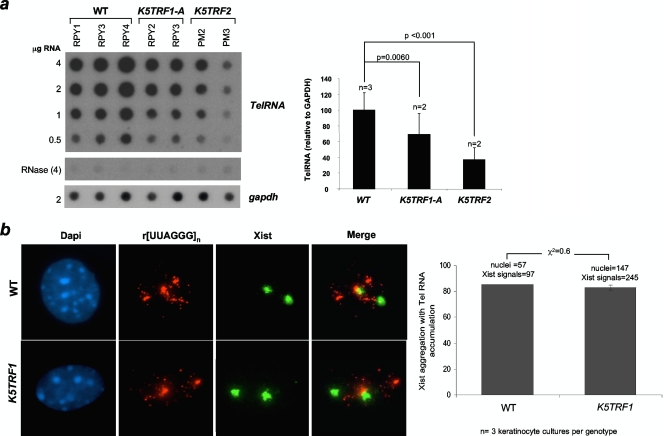
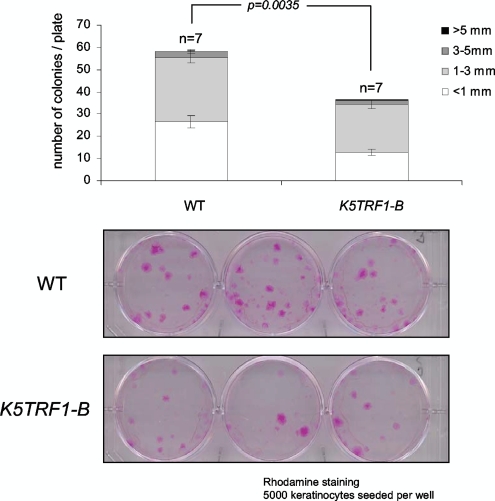
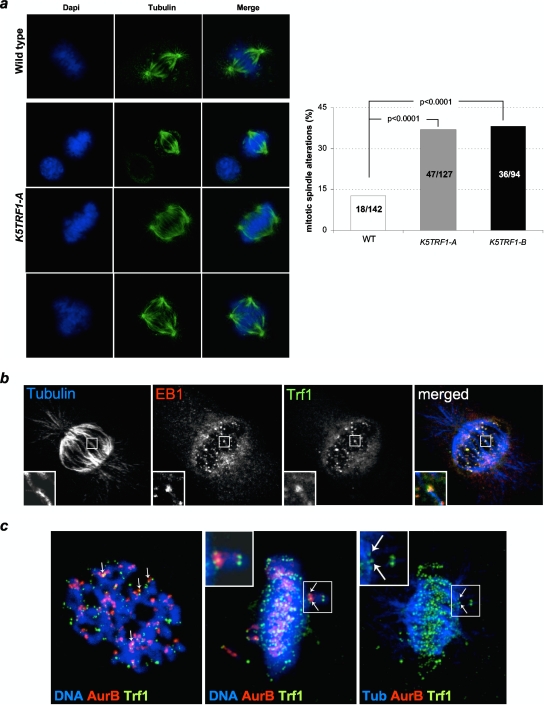
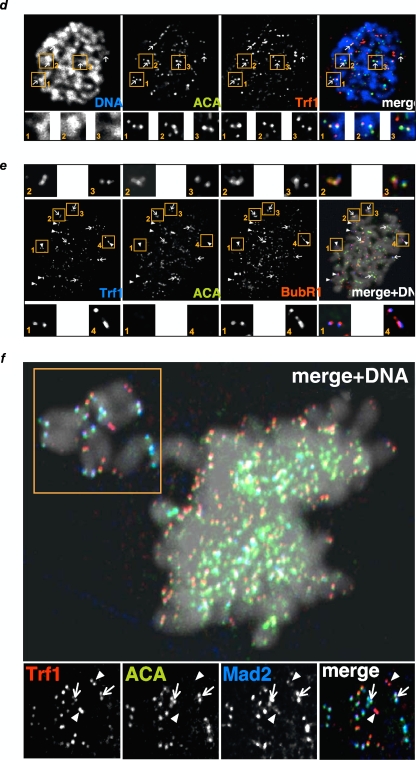
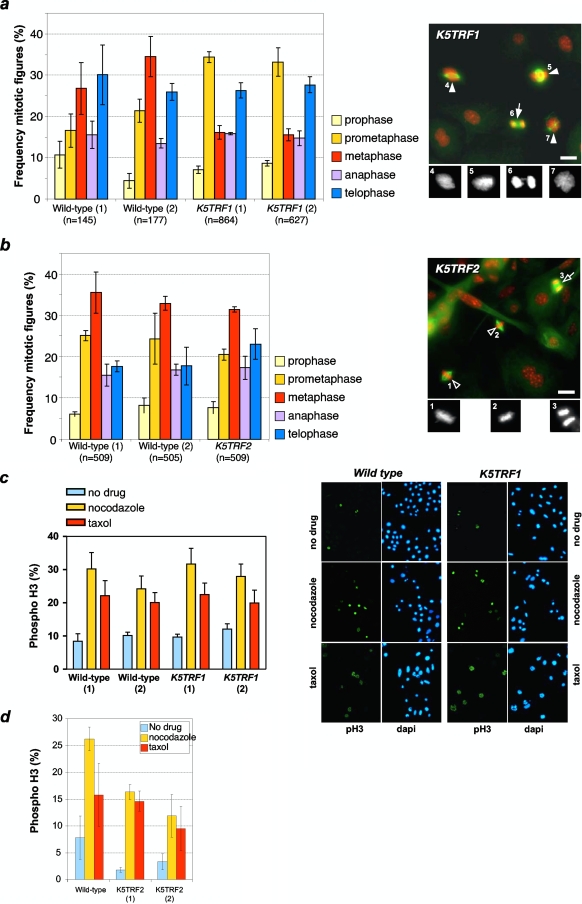
TRF1 is a component of the shelterin complex at mammalian telomeres; however, a role for TRF1 in telomere biology in the context of the organism is unclear. In this study, we generated mice with transgenic TRF1 expression targeted to epithelial tissues (K5TRF1 mice). K5TRF1 mice have shorter telomeres in the epidermis than wild-type controls do, and these are rescued in the absence of the XPF nuclease, indicating that TRF1 acts as a negative regulator of telomere length by controlling XPF activity at telomeres, similar to what was previously described for TRF2-overexpressing mice (K5TRF2 mice). K5TRF1 cells also show increased end-to-end chromosomal fusions, multitelomeric signals, and increased telomere recombination, indicating an impact of TRF1 on telomere integrity, again similar to the case in K5TRF2 cells. Intriguingly, K5TRF1 cells, but not K5TRF2 cells, show increased mitotic spindle aberrations. TRF1 colocalizes with the spindle assembly checkpoint proteins BubR1 and Mad2 at mouse telomeres, indicating a link between telomeres and the mitotic spindle. Together, these results demonstrate that TRF1, like TRF2, negatively regulates telomere length in vivo by controlling the action of the XPF nuclease at telomeres; in addition, TRF1 has a unique role in the mitotic spindle checkpoint.


Figures

FIG. 1.
FIG. 1.
Increased TRF1 expression in K5TRF1 mice. (a) Scheme of the K5TRF1 construct. (b) Quantification of TRF1 mRNA levels in mice from the indicated founder lines. Values represent the increases in TRF1 expression in K5TRF1 mice compared to that in wild-type controls. The number of mice (n) and mean ± standard error (SE) are indicated above each bar. (c) Quantification of TRF1 protein levels in wild-type and K5TRF1 primary keratinocytes by immunofluorescence. The number of keratinocyte cultures (n) and the mean ± SE are indicated above each bar. (d) Representative images of nuclear TRF1 in K5TRF1 keratinocytes. The TRF1-specific signal is shown in green. Note the higher TRF1 immunofluorescence in K5TRF1-A cells than in K5TRF1-B cells. (e) Quantification of TRF1 protein bound to telomeres. Values are expressed as mean ± SE increases in TRF1 levels in transgenic keratinocytes relative to those in nontransgenic keratinocytes. n, number of keratinocyte cultures. (f) Representative images of telomere-bound TRF1 in the indicated genotypes. The TRF1-specific signal is shown in green, telomeric sequences detected by telomere Q-FISH are shown in red, and colocalization is shown in yellow. (g) Telomere-bound TRF2 protein is not increased in K5TRF1 cells. Values are expressed as means ± SE relative to the wild-type level (100%). n, number of keratinocyte cultures. At least 400 TRF2 and 500 TRF1 signals were analyzed per genotype. As a control, K5TRF2 cells showed increased TRF2 bound to telomeres compared to wild-type controls, while telomere-bound TRF1 was not increased in these cells. (h) Representative images of TRF2 and TRF1 protein levels in the indicated genotypes. (Top) TRF2 is shown in green. (Bottom) TRF1 is shown in green. (i) Increased telomere-bound tankyrase 1 protein levels in K5TRF1 cells. Values are expressed as means ± SE relative to the wild-type level (100%). n, number of keratinocyte cultures. At least 45 nuclei were analyzed per genotype. (j) Representative images of tankyrase 1 immunofluorescence in wild-type and K5TRF1 cells. Note the higher tankyrase 1 signal in K5TRF1 cells.
FIG. 1.
FIG. 1.
Increased TRF1 expression in K5TRF1 mice. (a) Scheme of the K5TRF1 construct. (b) Quantification of TRF1 mRNA levels in mice from the indicated founder lines. Values represent the increases in TRF1 expression in K5TRF1 mice compared to that in wild-type controls. The number of mice (n) and mean ± standard error (SE) are indicated above each bar. (c) Quantification of TRF1 protein levels in wild-type and K5TRF1 primary keratinocytes by immunofluorescence. The number of keratinocyte cultures (n) and the mean ± SE are indicated above each bar. (d) Representative images of nuclear TRF1 in K5TRF1 keratinocytes. The TRF1-specific signal is shown in green. Note the higher TRF1 immunofluorescence in K5TRF1-A cells than in K5TRF1-B cells. (e) Quantification of TRF1 protein bound to telomeres. Values are expressed as mean ± SE increases in TRF1 levels in transgenic keratinocytes relative to those in nontransgenic keratinocytes. n, number of keratinocyte cultures. (f) Representative images of telomere-bound TRF1 in the indicated genotypes. The TRF1-specific signal is shown in green, telomeric sequences detected by telomere Q-FISH are shown in red, and colocalization is shown in yellow. (g) Telomere-bound TRF2 protein is not increased in K5TRF1 cells. Values are expressed as means ± SE relative to the wild-type level (100%). n, number of keratinocyte cultures. At least 400 TRF2 and 500 TRF1 signals were analyzed per genotype. As a control, K5TRF2 cells showed increased TRF2 bound to telomeres compared to wild-type controls, while telomere-bound TRF1 was not increased in these cells. (h) Representative images of TRF2 and TRF1 protein levels in the indicated genotypes. (Top) TRF2 is shown in green. (Bottom) TRF1 is shown in green. (i) Increased telomere-bound tankyrase 1 protein levels in K5TRF1 cells. Values are expressed as means ± SE relative to the wild-type level (100%). n, number of keratinocyte cultures. At least 45 nuclei were analyzed per genotype. (j) Representative images of tankyrase 1 immunofluorescence in wild-type and K5TRF1 cells. Note the higher tankyrase 1 signal in K5TRF1 cells.
FIG. 2.
FIG. 2.
Telomere shortening in K5TRF1 mice. (a) Quantification of telomere fluorescence in tail skin sections from wild-type (wt) (n = 4) and K5TRF1-A (n = 6) mice. Mean ± SE telomere fluorescence (in arbitrary units) and the number of telomere dots analyzed (n) are indicated. (b) Quantification of telomere fluorescence in tail skin sections from wild-type (wt) (n = 4) and K5TRF1-B (n = 4) mice. Mean ± SE telomere fluorescence (in arbitrary units) and the number of telomere dots analyzed (n) are indicated. (c) Quantification of telomere length (kb) in metaphase spreads of primary keratinocytes isolated from wild-type (wt) (n = 2) and K5TRF1-B (n = 4) newborn mice. Mean ± SE telomere length (kb) and the number of telomeres analyzed (n) are shown. (d) The percentages of signal-free ends (telomeres with an undetectable fluorescence signal) in metaphase spreads of wild-type (wt) (n = 2), K5TRF1-A (n = 5), and K5TRF1-B (n = 4) primary keratinocytes are represented with bars. The number of signal-free ends of the total telomere signals analyzed per genotype is indicated above each bar. (e) Telomere length, determined by telomere restriction fragment analysis, in primary keratinocytes isolated from wild-type (wt) and K5TRF1-B newborn mice. Numbers at the bottom identify the cultures. Asterisks indicate keratinocyte cultures also analyzed by Q-FISH for panel c. (f) Comparison of telomere lengths determined by Q-FISH in skin sections from K5TRF1-A and K5TRF1-B mice, as well as from G1, G2, and G3 Terc−/− mice in a C57BL/6 genetic background. The average telomere fluorescence of each genotype is represented relative to that of the corresponding wild-type (wt) control. Telomere length values for K5TRF1-A and -B keratinocytes were obtained from panels a and b. Telomere length values for G1, G2, and G3 Terc−/− keratinocytes were previously described by Blanco et al. (7). Data indicating the mean ± SE and statistical significance are indicated above each bar. (g) Percentages of telomeres showing telomere fluorescence of <20% or >80% that of wild-type controls. Values were obtained as indicated for panel f.
FIG. 2.
FIG. 2.
Telomere shortening in K5TRF1 mice. (a) Quantification of telomere fluorescence in tail skin sections from wild-type (wt) (n = 4) and K5TRF1-A (n = 6) mice. Mean ± SE telomere fluorescence (in arbitrary units) and the number of telomere dots analyzed (n) are indicated. (b) Quantification of telomere fluorescence in tail skin sections from wild-type (wt) (n = 4) and K5TRF1-B (n = 4) mice. Mean ± SE telomere fluorescence (in arbitrary units) and the number of telomere dots analyzed (n) are indicated. (c) Quantification of telomere length (kb) in metaphase spreads of primary keratinocytes isolated from wild-type (wt) (n = 2) and K5TRF1-B (n = 4) newborn mice. Mean ± SE telomere length (kb) and the number of telomeres analyzed (n) are shown. (d) The percentages of signal-free ends (telomeres with an undetectable fluorescence signal) in metaphase spreads of wild-type (wt) (n = 2), K5TRF1-A (n = 5), and K5TRF1-B (n = 4) primary keratinocytes are represented with bars. The number of signal-free ends of the total telomere signals analyzed per genotype is indicated above each bar. (e) Telomere length, determined by telomere restriction fragment analysis, in primary keratinocytes isolated from wild-type (wt) and K5TRF1-B newborn mice. Numbers at the bottom identify the cultures. Asterisks indicate keratinocyte cultures also analyzed by Q-FISH for panel c. (f) Comparison of telomere lengths determined by Q-FISH in skin sections from K5TRF1-A and K5TRF1-B mice, as well as from G1, G2, and G3 Terc−/− mice in a C57BL/6 genetic background. The average telomere fluorescence of each genotype is represented relative to that of the corresponding wild-type (wt) control. Telomere length values for K5TRF1-A and -B keratinocytes were obtained from panels a and b. Telomere length values for G1, G2, and G3 Terc−/− keratinocytes were previously described by Blanco et al. (7). Data indicating the mean ± SE and statistical significance are indicated above each bar. (g) Percentages of telomeres showing telomere fluorescence of <20% or >80% that of wild-type controls. Values were obtained as indicated for panel f.
FIG. 3.
FIG. 3.
XPF mediates telomere shortening in K5TRF1 epidermis. (a) Mean ± SE telomere fluorescence (in arbitrary units) and the numbers of telomeres and nuclei used are indicated. Mean telomere length is indicated with a red bar. Note that K5TRF1/K5TRF2 double-transgenic mice showed similarly short telomeres to those of K5TRF2 mice, suggesting that the TRF2 allele is dominant over TRF1, as both proteins were similarly overexpressed (twofold) in K5TRF1 and K5TRF2 cells compared to their respective wild-type controls (Fig. 1g). (b) Quantification of telomere fluorescence in tail skin sections from wild-type (WT), XPF−/−, K5TRF1, and double mutant K5TRF1/XPF−/− littermate mice (n = 2 to 4 mice per genotype). At least 864 telomere dots of each genotype were analyzed by Q-FISH. Average fluorescence (in arbitrary units) and SE are shown. Statistical significance is indicated in each comparison. (c) Representative images of telomere fluorescence in tail skin sections from wild-type (WT), XPF−/−, K5TRF1, and double mutant K5TRF1/XPF−/− littermate mice. The dermis and basal layer are indicated and separated by a white line.
FIG. 4.
FIG. 4.
Increased chromosomal instability and MMC hypersensitivity in K5TRF1 cells. (a and b) Quantification of chromosomal aberrations per metaphase in primary keratinocytes isolated from K5TRF1-A (a) and K5TRF1-B (b) mice. Values above each bar indicate the total number of chromosomal aberrations out of the total number of metaphases analyzed. n, number of independent keratinocyte cultures analyzed per genotype. (c) K5TRF1 cells are hypersensitive to MMC treatment. Error bars represent SE. n, number of keratinocyte cultures used. (d) Quantification of chromosomal aberrations after MMC treatment for the indicated genotypes. The frequency of chromosomal aberrations out of the total number of metaphases analyzed is indicated above each bar. The chi-square test was used for statistical significance calculations. n, number of independent keratinocyte cultures examined per genotype. (e) Representative examples of the indicated chromosomal aberrations in K5TRF1 cells. (f and g) Increased γH2AX foci in K5TRF1 skin sections for both K5TRF1-A and K5TRF1-B founder lines. The percentage of γH2AX-positive cells per genotype is indicated. Values are expressed as means ± SE.
FIG. 5.
FIG. 5.
Increased telomere recombination in K5TRF1 keratinocytes. (a) Quantification of frequency of T-SCE events in wild-type (wt), K5TRF1-A, and K5TRF1-B keratinocytes analyzed by CO-FISH. The number of T-SCE events and the total number of analyzed chromosome are indicated on top of each bar. n, number of independent keratinocyte cultures. Statistical significance, calculated by the chi-square test, is shown. (b) Representative CO-FISH images of metaphases of the indicated genotypes hybridized with specific probes against leading (green fluorescence) and lagging (red fluorescence) telomeres.
FIG. 6.
FIG. 6.
Reduced telomere transcription in K5TRF1 and K5TRF2 cells. (a) Quantification of TelRNA levels. Average values and standard deviations were obtained for two or three independent keratinocyte cultures. GAPDH, glyceraldehyde-3-phosphate dehydrogenase. (b) Telomere RNAs accumulate near the Xist RNA marking the inactive X chromosome in both wild-type (WT) and K5TRF1 cells.
FIG. 7.
FIG. 7.
Decreased clonogenic activity of K5TRF1 ESCs. The graph shows quantification of the size and number of macroscopic colonies obtained from keratinocytes isolated from wild-type (WT) and K5TRF1-B newborn mice. n, number of independent keratinocyte cultures. Representative examples of clones obtained from the indicated genotypes are shown in the bottom panel. Clones were visualized by staining with rhodamine.
FIG. 8.
FIG. 8.
TRF1 colocalizes with SAC proteins in K5TRF1 cells. (a) Representative images of aberrant mitotic spindles in wild-type (WT) and K5TRF1 primary keratinocytes. α-Tubulin is shown in green. The graph shows the percentages of aberrant mitotic spindles in wild-type and K5TRF1 primary keratinocytes. The number of aberrant mitotic spindles and the total number of spindles analyzed are indicated in each bar. (b to d) TRF1 colocalizes with SAC proteins in K5TRF1 chromosomes. Colocalization was seen between TRF1 and EB1 (plus end of microtubules close to kinetochores) (b), TRF1 and Aurora B (kinetochores) (c), and TRF1 and the centromere antigen ACA (d). (e) The SAC protein BubR1 colocalizes with TRF1 at both centromeres and p-arm telomeres (panels 2 and 3), as well as at the q-arm telomeres (panels 1 and 4), where ACA is absent. (f) Colocalization of TRF1 and Mad2. Some misaligned chromosomes (square) in K5TRF1 keratinocytes maintain Mad2 staining that colocalizes with TRF1, not only at the p arms, where ACA is positive (arrows), but also at the q-arm telomeres, which are negative for ACA (arrowheads).
FIG. 8.
FIG. 8.
TRF1 colocalizes with SAC proteins in K5TRF1 cells. (a) Representative images of aberrant mitotic spindles in wild-type (WT) and K5TRF1 primary keratinocytes. α-Tubulin is shown in green. The graph shows the percentages of aberrant mitotic spindles in wild-type and K5TRF1 primary keratinocytes. The number of aberrant mitotic spindles and the total number of spindles analyzed are indicated in each bar. (b to d) TRF1 colocalizes with SAC proteins in K5TRF1 chromosomes. Colocalization was seen between TRF1 and EB1 (plus end of microtubules close to kinetochores) (b), TRF1 and Aurora B (kinetochores) (c), and TRF1 and the centromere antigen ACA (d). (e) The SAC protein BubR1 colocalizes with TRF1 at both centromeres and p-arm telomeres (panels 2 and 3), as well as at the q-arm telomeres (panels 1 and 4), where ACA is absent. (f) Colocalization of TRF1 and Mad2. Some misaligned chromosomes (square) in K5TRF1 keratinocytes maintain Mad2 staining that colocalizes with TRF1, not only at the p arms, where ACA is positive (arrows), but also at the q-arm telomeres, which are negative for ACA (arrowheads).
FIG. 9.
FIG. 9.
Transgenic TRF1 expression induces aberrant mitotic spindles. (a) (Left) Quantification of the five different mitotic phases (prophase, prometaphase, metaphase, anaphase, and telophase). Wild-type and K5TRF1 keratinocytes were stained for α-tubulin, phospho-histone H3, and DNA (DAPI), and mitotic cells were counted in three different experiments. K5TRF1 cells showed an increased number of prometaphases compared to wild-type cells. (Right) K5TRF1 cells showed dramatic mitotic aberrations, with aberrant metaphase plates (closed arrowheads) and chromosome bridges (closed arrow). Cells were stained for α-tubulin (green) and DNA (red). The bottom panels are a detailed representation of the DAPI staining. Bar, 20 μm. Numbers are for identification of individual mitoses. (b) (Left) Quantification of the five different mitotic phases (prophase, prometaphase, metaphase, anaphase, and telophase). Wild-type and K5TRF2 keratinocytes were stained for α-tubulin, phospho-histone H3, and DNA (DAPI), and mitotic cells were counted in three different experiments. Unlike K5TRF1 cells, K5TRF2 cells did not show any difference from the wild-type cells. (Right) In accordance with the previous observation, K5TRF2 metaphases were normal (open arrowheads) and anaphases did not show chromosome bridges (open arrow). Cells were stained for α-tubulin (green) and DNA (red). The bottom panels are a detailed representation of the DAPI staining. Bar, 20 μm. Numbers are for identification of individual mitoses. (c) K5TRF1 keratinocytes display an efficient mitotic assembly checkpoint in the presence of paclitaxel (Taxol) or nocodazole. (Left) Percentages of phospho-H3-positive cells after the indicated treatments. Numbers in parentheses refer to independent keratinocyte cultures. (Right) Representative images of wild-type and K5TRF1 phospho-H3-positive keratinocytes. (d) K5TRF2 cells have a robust spindle assembly checkpoint. When K5TRF2 cells were poisoned with either paclitaxel (Taxol) or nocodazole, they had a three- to fivefold increase in the mitotic index due to SAC activation.

Similar articles

Cited by

References

    1. Ancelin, K., M. Brunori, S. Bauwens, C. E. Koering, C. Brun, M. Ricoul, J. P. Pommier, L. Sabatier, and E. Gilson. 2002. Targeting assay to study the cis functions of human telomeric proteins: evidence for inhibition of telomerase by TRF1 and for activation of telomere degradation by TRF2. Mol. Cell. Biol. 223474-3487. - PMC - PubMed
    1. Azzalin, C. M., P. Reichenbach, L. Khoriauli, E. Giulotto, and J. Lingner. 2007. Telomeric repeat containing RNA and RNA surveillance factors at mammalian chromosome ends. Science 318798-801. - PubMed
    1. Bailey, S. M., M. A. Brenneman, and E. H. Goodwin. 2004. Frequent recombination in telomeric DNA may extend the proliferative life of telomerase-negative cells. Nucleic Acids Res. 323743-3751. - PMC - PubMed
    1. Barrandon, Y., and H. Green. 1987. Three clonal types of keratinocyte with different capacities for multiplication. Proc. Natl. Acad. Sci. USA 842302-2306. - PMC - PubMed
    1. Bechter, O. E., Y. Zou, W. Walker, W. E. Wright, and J. W. Shay. 2004. Telomeric recombination in mismatch repair deficient human colon cancer cells after telomerase inhibition. Cancer Res. 643444-3451. - PubMed

Publication types

MeSH terms

LinkOut - more resources