. 2009 Mar;19(3):360-71.
doi: 10.1101/gr.084970.108. Epub 2009 Jan 5.

A canonical promoter organization of the transcription machinery and its regulators in the Saccharomyces genome

Affiliations

A canonical promoter organization of the transcription machinery and its regulators in the Saccharomyces genome

Bryan J Venters et al. Genome Res. 2009 Mar.

Abstract

The predominant organizational theme by which the transcription machinery and chromatin regulators are positioned within promoter regions or throughout genes in a genome is largely unknown. We mapped the genomic location of diverse representative components of the gene regulatory machinery in Saccharomyces cerevisiae to an experimental resolution of <40 bp. Sequence-specific gene regulators, chromatin regulators, mediator, and RNA polymerase (Pol) II were found primarily near the downstream border from the "-1" nucleosome, which abuts against the approximately 140-bp nucleosome-free promoter region (NFR). General transcription factors TFIIA, -B, -D, -E, -F, -H were located near the downstream edge from the NFR. The -1 nucleosome dissociated upon Pol II recruitment, but not upon recruitment of only TBP and TFIIB. The position of many sequence-specific regulators in promoter regions correlated with the position of specific remodeling complexes, potentially reflecting functional interactions. Taken together the findings suggest that the combined action of activators and chromatin remodeling complexes remove the -1 nucleosome after the preinitiation complex (PIC) has partially assembled, but before or concomitant with Pol II recruitment. We find PIC assembly, which includes Pol II recruitment, to be a significant rate-limiting step during transcription, but that additional gene-specific rate-limiting steps associated with Pol II occur after recruitment.


Figures

Figure 1.
Figure 1.
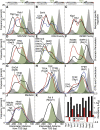
Distribution of transcription factor occupancy at selected genes. ChIP-chip on Affymetrix high-density tiling arrays was performed on representative transcription factors. Each individual bar in the graph represents the normalized signal from a 150-bp sliding window in 5-bp steps for the bound factor indicated to the right of each panel. The locations of H2A.Z-containing nucleosomes are also shown as 147-bp black boxes (Albert et al. 2007). The distribution of factors is anecdotal and should not be interpreted as the consensus location with respect to specific genomic landmarks. (A) Anecdotal example of genes covering a range of transcription frequencies (Holstege et al. 1998), showing a corresponding level of PIC components. (B) Anecdotal example of factor occupancy in regions producing confirmed antisense transcripts (red arrow) (David et al. 2006; Perocchi et al. 2007). (C) Anecdotal example of factor occupancy at divergent, highly transcribed genes. (D) An enlarged view of GAL10. (GAL10 sense transcription is expected to be silent under the glucose-containing media in which this experiment was performed.)
Figure 2.
Figure 2.
Error assessment of factor mapping. The cumulative error plots for Reb1, TBP, and Sua7 are shown. Cumulative error is the maximum allowable bp distance between predicted and measured locations. Only data that were within 250 bp of a reference point were considered. The median mapping error and number of data points (n) are indicated above each plot.
Figure 3.
Figure 3.
High-resolution map of the organization of the transcription machinery at promoter regions. ChIP-chip on Affymetrix high-density tiling arrays was used to determine the binding location for representative transcription initiation factors. To provide reference landmarks, the genome-wide frequency distributions for H2A.Z nucleosomes determined by ChIP-seq (Albert et al. 2007) and for conserved TATA consensus sites (Basehoar et al. 2004) are shown in gray and green, respectively. (AE) The composite frequency distributions for the binding locations (peak calls from normalized signal with an FDR <5%) for representative components of the transcription machinery are shown relative to the TSS of protein coding genes. (F) Shown are the composite frequency distributions for the nucleosome sequence reads (Mavrich et al. 2008) for all genes (black trace), for genes containing high levels of Pol II in the promoter region (−500 bp to 100 bp relative to TSS, blue trace), and for genes containing both TBP and TFIIB, but not Pol II, in the promoter region (red trace). The bin counts are expressed as a percentage of the total for each trace over the indicated range so as to compare relative peak heights within traces. Genes that contained high levels of Pol II generally had lower overall levels of nucleosomes.
Figure 4.
Figure 4.
Pol II density across genes. (A) Cluster plot of Pol II density across individual genes. Normalized Pol II (Rpo21) ChIP-chip signal was binned in 20-bp increments for intergenic regions (denoted “IGR”) from the TSS to 500 bp upstream. The same was done for genic regions (denoted Gene) except that the data were parsed into 50 equal sized bins (and thus represents a percentage of the gene length, rather than absolute distance). The normalized signal within each bin was averaged, K-means clustered (k = 4, the fourth group of ∼3000 genes is not shown because very little Pol II was observed in the vicinity of the genes), and displayed using Treeview (Eisen et al. 1998). Pol II enrichment and transcription frequency are shown in blue. The transcription frequency, denoted as mRNA/hr (Holstege et al. 1998), for each gene was aligned to the cluster order and displayed, and the average value for each cluster was reported. Also shown are representative screenshots of the normalized signal distribution for Pol II and other factors at individual genes from groups 1–3. The identity of the genes in groups 1–3 can be found in Supplemental Table S5 (column J). (B) The composite frequency distribution of Pol II (Rpo21) intensity peaks relative to the transcript termination site (TTS) (i.e., the site of polyA addition). All TTS are shown in black, and only those that are downstream from two converging genes are shown in red (designated T-T). The distribution of nucleosomes is shown as a gray fill (Mavrich et al. 2008). (C) Pol II is mostly absent from lowly transcribed genes and abundant at highly transcribed genes. The gene having the highest average Pol II density was identified (RPS3), and set to the maximum level of Pol II occupancy (100 arbitrary units). The average Pol II density for three classes of genes, relative to this maximum was assessed: 311 genes in the lowest fifth percentile of transcription frequency (Holstege et al. 1998), 61 mid-late sporulation genes (SP) (Gasch et al. 2000), and 132 ribosomal protein genes (RPG). For each group of genes, the median percentage value is plotted. (D) Most genes have very little bound Pol II. The percentage of all 5228 protein coding genes (y-axis) that has less than the indicated Pol II level (as a percentage of the level found at RPS3) is plotted. For example, 50% of all genes have <5% of the maximum level of Pol II. The region examined for each gene was from 100 bp upstream of the TSS (or 160 bp upstream of the ORF start, if no TSS was present) to the TTS (or ORF endpoint, if no TTS was present). (E) Highly and lowly expressed genes display distinct Pol II distributions across genes. The average Pol II density throughout genes is plotted for the 311 genes in the upper fifth percentile (denoted 95–100%) and 3208 genes in the lower 65th percentile (denoted 0–65%) of transcription frequency (Holstege et al. 1998).
Figure 5.
Figure 5.
Genome-wide spatial assembly of the transcription machinery in the context of chromatin. (AK) The composite frequency distributions for the binding locations for components of the transcription machinery are shown for all protein coding genes relative to the TSS (false discovery rates for each factor are reported in Supplemental Table S1). The distribution of TATA boxes when present (green fill) (Basehoar et al. 2004) and H2A.Z promoter nucleosomes (gray fill) (Albert et al. 2007), which are shown in each panel. (L) Occupancy detected toward the 3′ end of each gene (designated ORF) is compared to occupancy in the promoter region. Shown in the bar graph are the median occupancy values for all genes in which occupancy of at least one region (ORF or Promoter) met the 5% FDR cut-off.
Figure 6.
Figure 6.
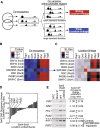
Sequence-specific regulators are location-linked to chromatin remodelers. (A) Schematic overview of the location-linkage analysis. Statistically significant promoter co-occupancy between a sequence-specific regulator and chromatin remodeler was computed using CHITEST function in Excel. Two factors are location-linked if their positions covary at genes in which they co-occupy. The extent to which two factors covary across all co-occupied promoters was determined by computing the standard deviation for the distances between their co-occupied binding locations. (B) Promoter co-occupancy between sequence-specific regulators and chromatin remodelers. Red reflects greater co-occupancy significance; blue, less significance relative to P = 10−5. (C) Location linkage of sequence-specific regulators and chromatin remodelers. Brighter red indicates far less than the average standard deviation of pairwise distances (greater location-linkage). Darker blue indicates greater than average standard deviation (less location-linkage). Co-occupancy pairs that did not pass criterion 1 are shown with lighter shading. (D) ChIP-chip was used to determine the changes in occupancy for Swi3-TAP (SWI/SNF) in a swi4Δ strain. The Swi3-TAP occupancy changes for the genes that are Swi4-Swi3 location linked (panels B,C) are displayed as a bar graph. (E) Standard ChIP was performed on four of the genes most dependent on Swi4 for SWI/SNF recruitment (CSI2, SIM1, PCL1, and PLB2). A no template control (NTC) and a mock IP using an untagged BY4741 strain are shown. The PCR products from four biological replicates were quantified, and the log2 ratios (swi4Δ/WT) ± SD for the Swi3-TAP changes in occupancy are displayed to the right of the PCR product for each gene. Loss of SWI4 did not diminish Swi3-TAP expression or its global distribution (Supplemental Fig. S9).
Figure 7.
Figure 7.
Illustration of the spatial assembly of the transcription machinery and chromatin regulators at promoters bracketed by the −1 and +1 nucleosomes. The coordinate system is based upon the location of the TSS (arrow). Locations are more approximate (±∼20 bp) than indicated by the lines attached to the coordinate. This view is a composite, and thus not all factors occupy the same set of genes.

Similar articles

Cited by

References

    1. Albert I., Mavrich T.N., Tomsho L.P., Qi J., Zanton S.J., Schuster S.C., Pugh B.F. Translational and rotational settings of H2A.Z nucleosomes across the Saccharomyces cerevisiae genome. Nature. 2007;446:572–576. - PubMed
    1. Angermayr M., Bandlow W. Permanent nucleosome exclusion from the Gal4p-inducible yeast GCY1 promoter. J. Biol. Chem. 2003;278:11026–11031. - PubMed
    1. Arigo J.T., Eyler D.E., Carroll K.L., Corden J.L. Termination of cryptic unstable transcripts is directed by yeast RNA-binding proteins Nrd1 and Nab3. Mol. Cell. 2006;23:841–851. - PubMed
    1. Basehoar A.D., Zanton S.J., Pugh B.F. Identification and distinct regulation of yeast TATA box-containing genes. Cell. 2004;116:699–709. - PubMed
    1. Berger S.L. Gene regulation. Local or global? Nature. 2000;408:412–413, 415. - PubMed

Publication types

MeSH terms